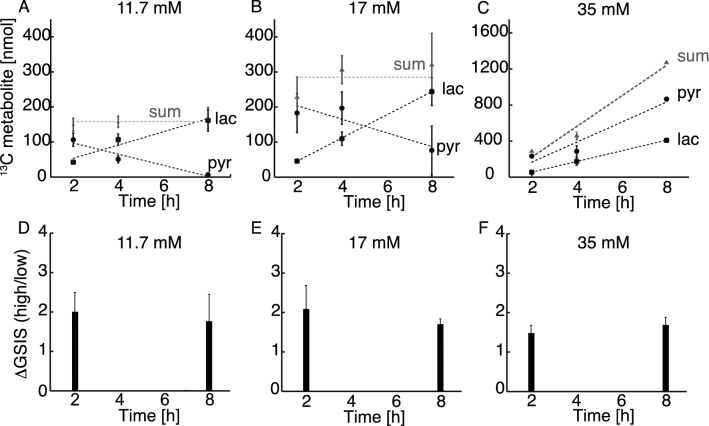
Figure 6.
(A–C) The two main metabolites lactate and pyruvate and their sum responding over time to various glucose concentrations (11.7, 17 and 35 mM). The sum of pyruvate and lactate did not change significantly over time (p > 0.05, ANOVA followed by Student’s t-tests). (D–F) The corresponding glucose stimulated insulin secretion (GSIS) as a ratio between high and low glucose stimulation (2 and 17 mM glucose respectively) from GSIS experiment carried out after either 2 or 8 h of incubation with the three glucose concentrations (n = 4). No significant change was found, neither as function of time (2–8 h) nor concentration (11.7–35 mM) (p = 0.8 for 11.7 mM, p = 0.5 for 17 mM and p = 0.4 for 35 mM ΔGSIS 2 h vs 8 h, Student’s t-tests). The responses to incubations are similar for all conditions.

