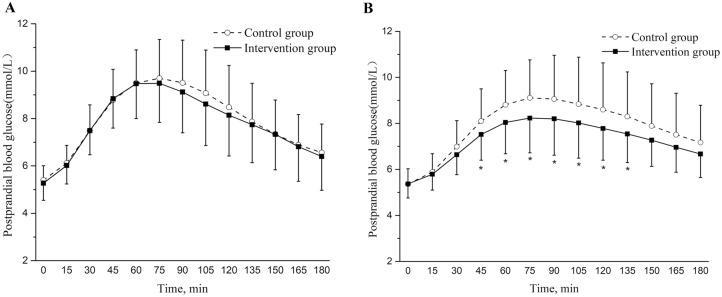
Fig. 2.
Changing trends of the postprandial blood glucose levels measured by flash glucose monitoring every 15 min between the two groups at baseline (a) and after the intervention (b). The difference between groups was not significant at baseline (P = 0.133), but was significant after the intervention (P = 0.036). P values are for differences between groups by two-way mixed repeat- measures ANOVA. The post-meal glucose differences at each time point between the two groups were analyzed using t tests. Compared to the control group, the post-meal blood glucose level at 45–135 min after the main meal was significantly lower in the intervention group (*P < 0.05)

