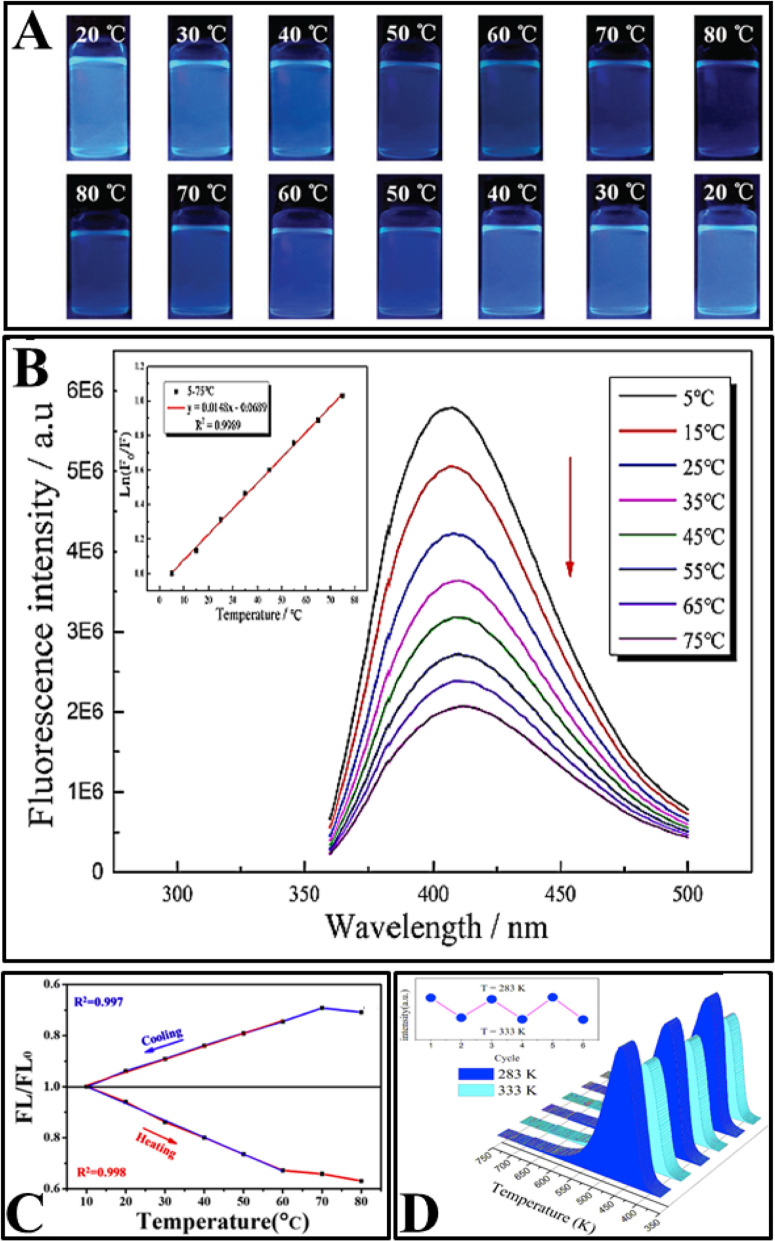
Fig. 6.
a Digital photographs of N, S-CDs under UV light (365 nm) excitation at different temperatures during heating (upper) and cooling processes (lower). (Reproduced from reference [96]). b Fluorescence emission spectra of N, S co-doped CDs measured in the range of 5–75 °C (top to bottom) when excited at 340 nm, inset: the corresponding linear regression of the temperature versus Ln (F/F0). (Reproduced from reference [97]). c FL/FL0-temperature plots of MnOx-CDs during cooling and heating processes. (Reproduced from reference [103]). d Reversible temperature-dependence of the PL of the CDs solution. (Reproduced from reference [102])

