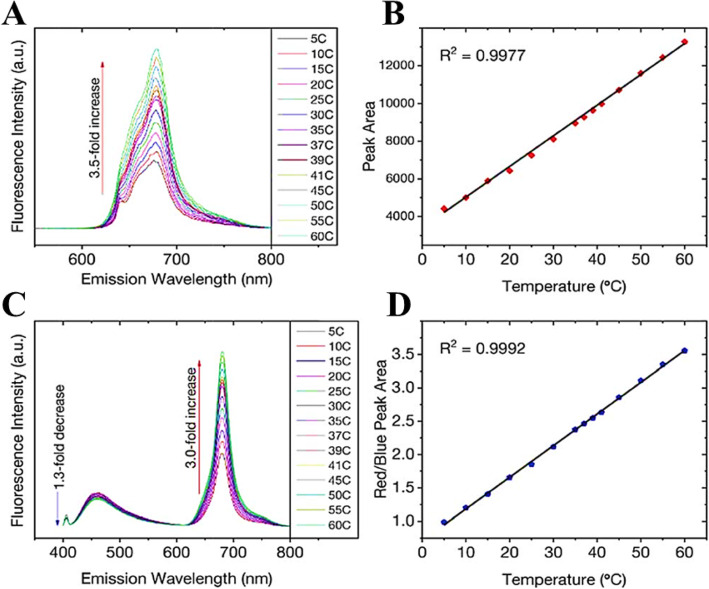
Fig. 8.
a Excitation at 640 nm yields a 3.5-fold increase in fluorescence intensity and the corresponding integrated area is plotted in b showing a linear response over the range of 5–60 °C. c Changes in the fluorescence spectra of the CDs (λex = 405 nm) as a function of temperature over the entire range. A 1.3-fold decrease is noted for the blue fluorescence in contrast to the 3-fold increase for the red counterpart. d The ratio of the integrated areas of the red and blue fluorescence components are plotted as a function of temperature showing a linear increase over the entire temperature range. (Reproduced from reference [29])

