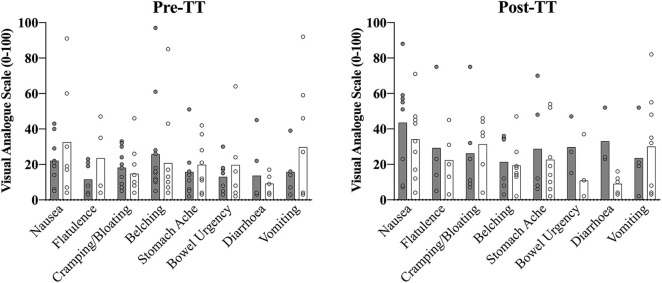
Figure 5.
Summed descriptive (individual and mean ± SD) symptom data collated from the GI questionnaire (0–100 point visual analog scale) prior to the start of the 2,000-m TT (Pre-TT) and upon completion (Post-TT) for both the consensus standard (CON; gray bar) and individualized peak (IP; open black border) trials.

