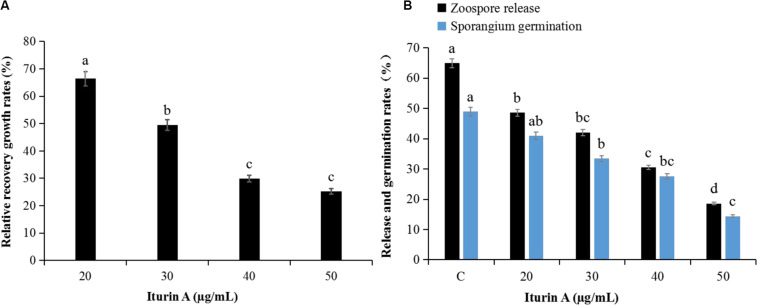
FIGURE 2.
Recovery of P. infestans mycelium and sporangia after inhibition by Iturin A (concentrations at 20, 30, 40, and 50 μg/mL, respectively). (A) Relative recovery growth rates of mycelium, (B) Zoospore release and direct germination rates of sporangium after inhibition. The capital letter C means the control group, and the different lowercase letters indicate a significant difference between the different groups at the level of P < 0.05.

