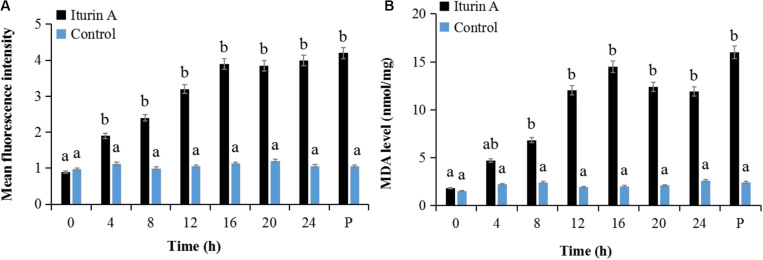
FIGURE 5.
Reactive oxygen species (ROS) generation and malondialdehyde (MDA) production in P. infestans cell after Iturin A inhibition. (A) Mean fluorescence intensity of DCFH-DA (2′, 7′-dichlorodihydrofluorescein diacetate) for ROS detection, (B) MDA production. The capital letter P indicates the positive control (Rosup), and the lowercase letters a and b indicate a significant difference (P < 0.05) within the same treatment group.

