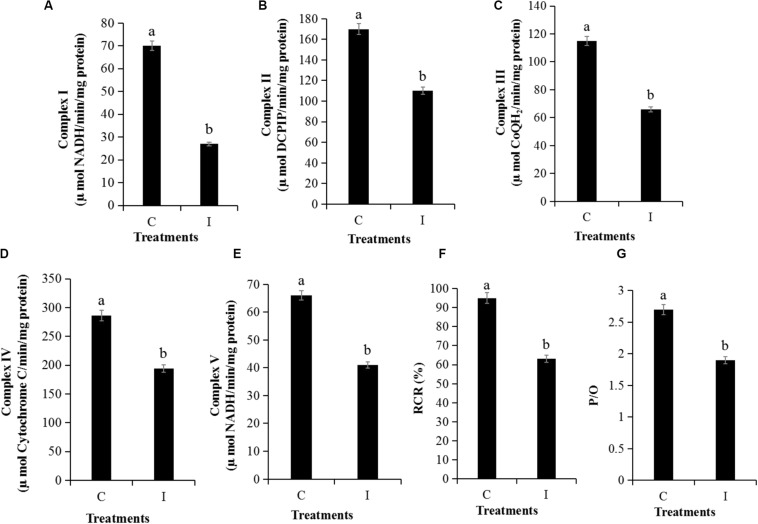
FIGURE 7.
Detection of mitochondrial respiratory activity of P. infestans cell after Iturin A (50 μg/mL) inhibition for 16 h. (A–E) Mitochondrial respiratory chain complexes activity (MRCCA) of I to V, respectively, (F) Respiratory control rate (RCR), (G) Oxidative phosphorylation efficiency (P/O). The capital letters C and I represent the control and Iturin A treatment groups, respectively, and the different lowercase letters indicate a significant difference (P < 0.05).

