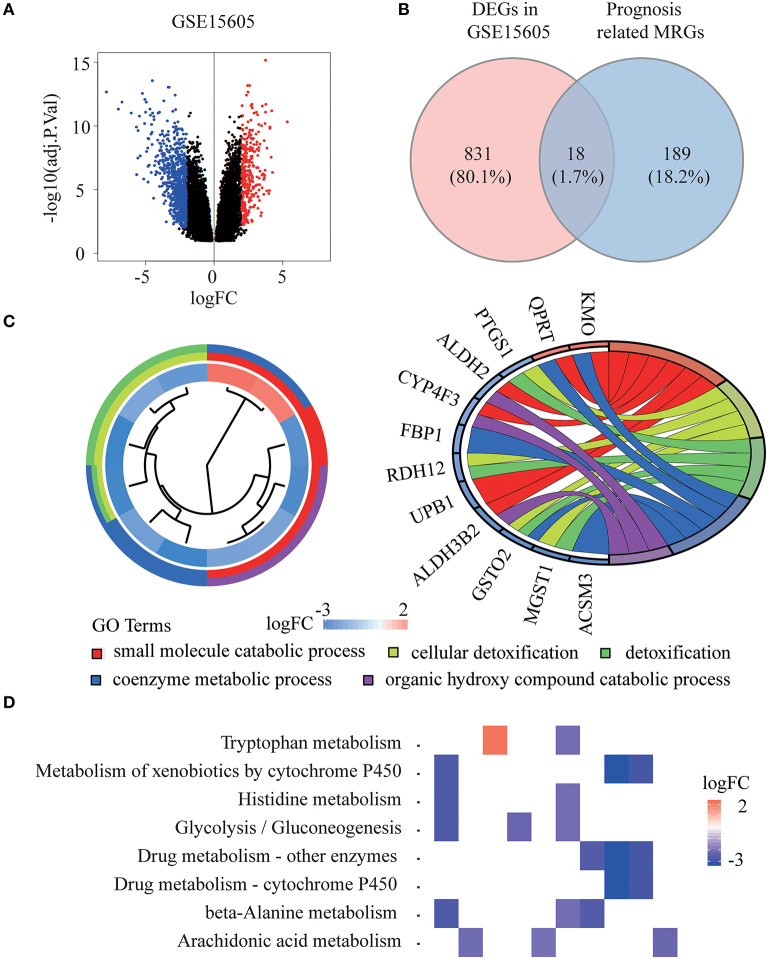
Figure 2.
Identification of prognostic metabolism related genes (MRGs) and functional enrichment analysis. (A) Volcano plot of differentially expressed genes (DEGs) between melanoma and normal samples of GSE15605 dataset. The red dots represent up-regulated genes, and the green dots represent down-regulated genes (adj. P < 0.01 and |log2 (FC) | > 2). (B) Venn diagram showing the intersection of the DEGs in GSE15605 and prognosis related MRGs. (C,D) Gene ontology (GO) terms (C) and Kyoto Encyclopedia of Gene and Genomes (KEGG) pathways (D) of 18 prognostic MRGs.

