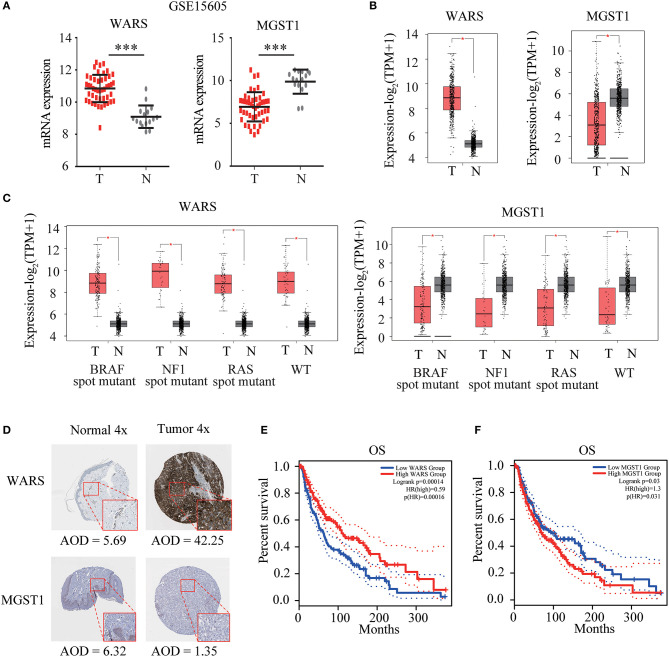
Figure 4.
Verification of WARS and MGST1. (A) The expression of WARS and MGST1 between melanoma and normal skin in GSE15605. N (T) = 46 and N (N) = 16. ***P < 0.001. (B) The expression of WARS and MGST1 between melanoma and normal skin using Gene Expression Profiling Interactive Analysis (GEPIA) database. The number of sorts: N (T) = 460 and N (N) = 558. (C) The expression of WARS and MGST1 in three mutational signatures (BRAF, NF1 and RAS) and wild types (WT) of melanoma. The number of sorts: N (T) = 147 and N (N) = 558 in BRAF mutation; N (T) = 27 and N (N) = 558 in NF1 mutation; N (T) = 91 and N (N) = 558 in RAS mutation; N (T) = 47 and N (N) = 558 in WT. (D) The representative protein expressions of WARS and MGST1 between normal and melanoma tissues in the Human Protein Atlas database (http://www.proteinatlas.org). AOD, average optical density, calculated by integrated optical density/area. The expressions were quantified by Image J (version 1.52a). (E,F) Kaplan-Meier curves for overall survival (OS) of WARS (E) and MGST1 (F) in melanoma patients using GEPIA. N (high) = 229, N (low) = 229. T, tumor; N, normal skin. *P < 0.05.

