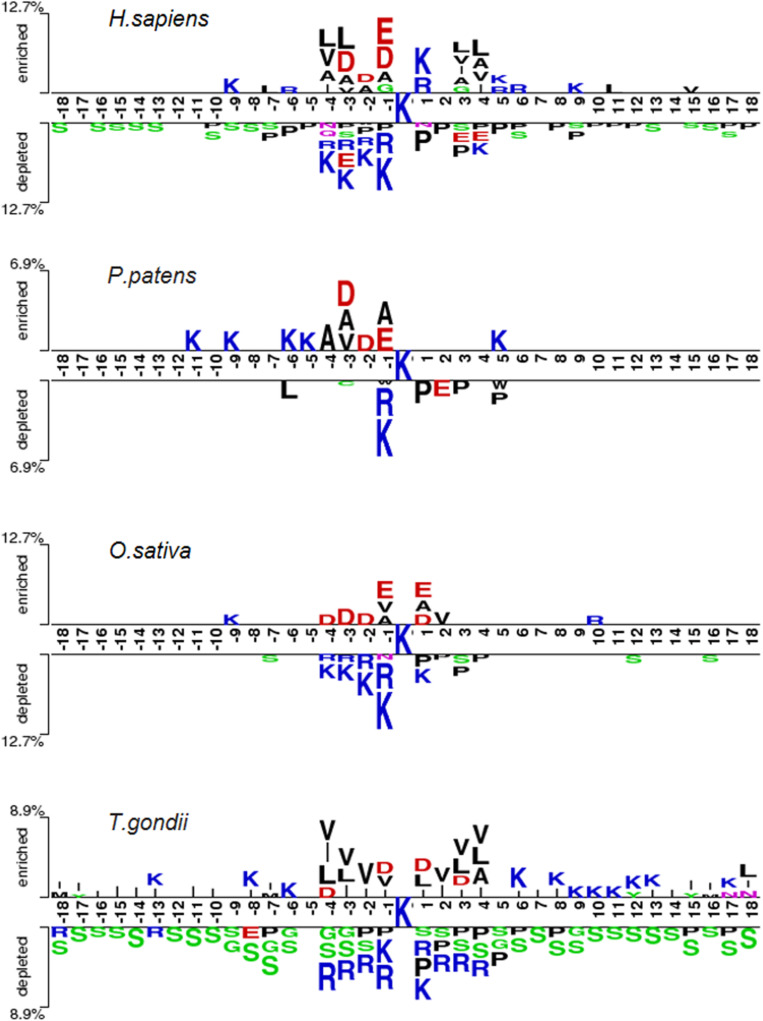
FIGURE 4.
Sequence pattern surrounding the Khib sites, including the significantly enriched and depleted residues based on Khib peptides and non-modification peptides from different species (P < 0.05, student’s T-test with Bonferroni correction). The pattern was generated using the two-sample-logo method (Vacic et al., 2006).

