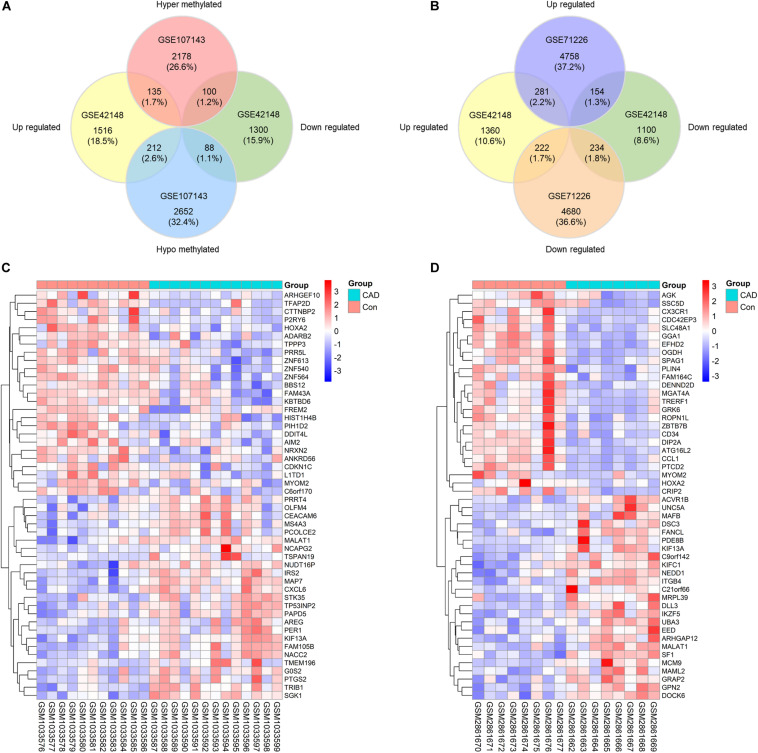
FIGURE 2.
Identification of differentially expressed-methylated genes. (A) Venn plot of differentially expressed genes in dataset GSE42148 and differentially methylated genes in dataset GSE107143. (B) Venn plot of differentially expressed genes in dataset GSE42148 and GSE71226. (C,D) Representative heat map of the top 50 DEMGs in dataset GSE42148 and GSE107143.

