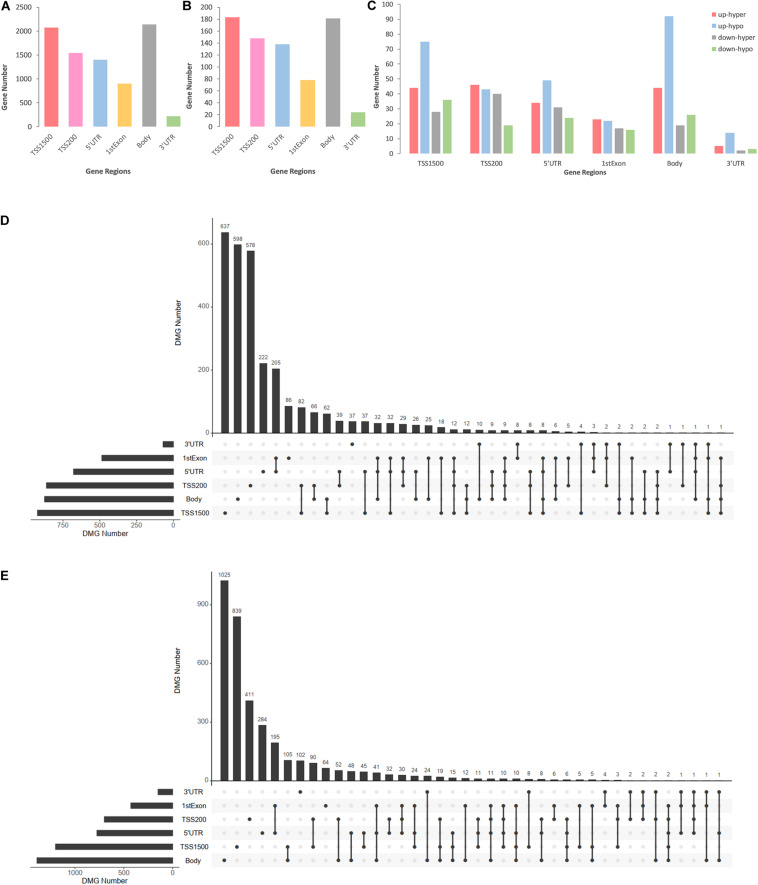
FIGURE 3.
Consolidation analysis results of gene region distributions of intragenic DMCs. (A) Bar plot for intragenic DMCs in different regions of DMGs. (B) Bar plot for intragenic DMCs in different regions of DEMGs. (C) Bar plot for intragenic DMCs in different regions of four DEMGs groups. (D) UpSet plot for intragenic DMCs in different regions of hypermethylated genes. (E) UpSet plot for intragenic DMCs in different regions of hypomethylated genes.

