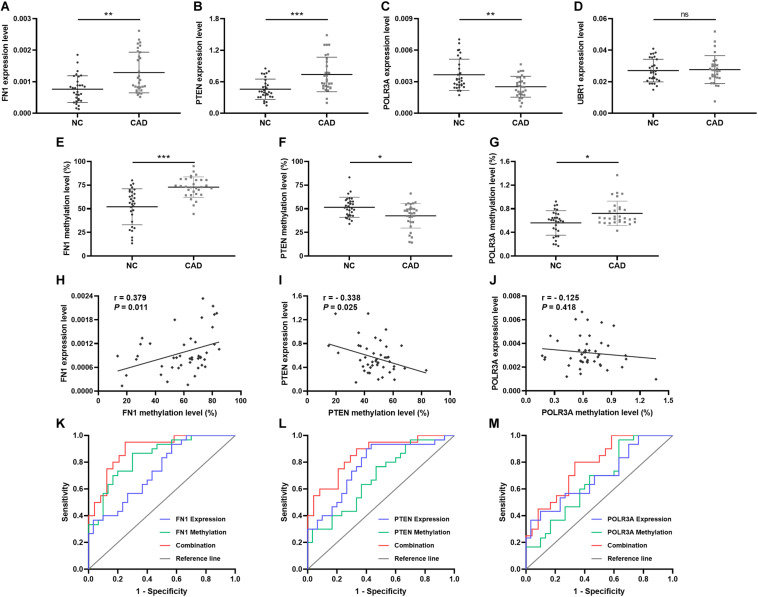
FIGURE 6.
Relative expression, methylation, and ROC of top hub genes from 4 DEMGs subgroups. Expression level in 30 CAD patients and 30 controls. (A) FN1. (B) PTEN. (C) POLR3A. (D) UBR1. Methylation levels in 30 CAD patients and 30 controls. (E) FN1. (F) PTEN. (G) POLR3A. Correlation between expression and methylation. (H) FN1. (I) PTEN. (J) POLR3A. ROC is based on expression and methylation separately or combined. (K) FN1. (L) PTEN. (M) POLR3A. All experiments were performed twice. *P < 0.05, **P < 0.01, ***P < 0.001.

