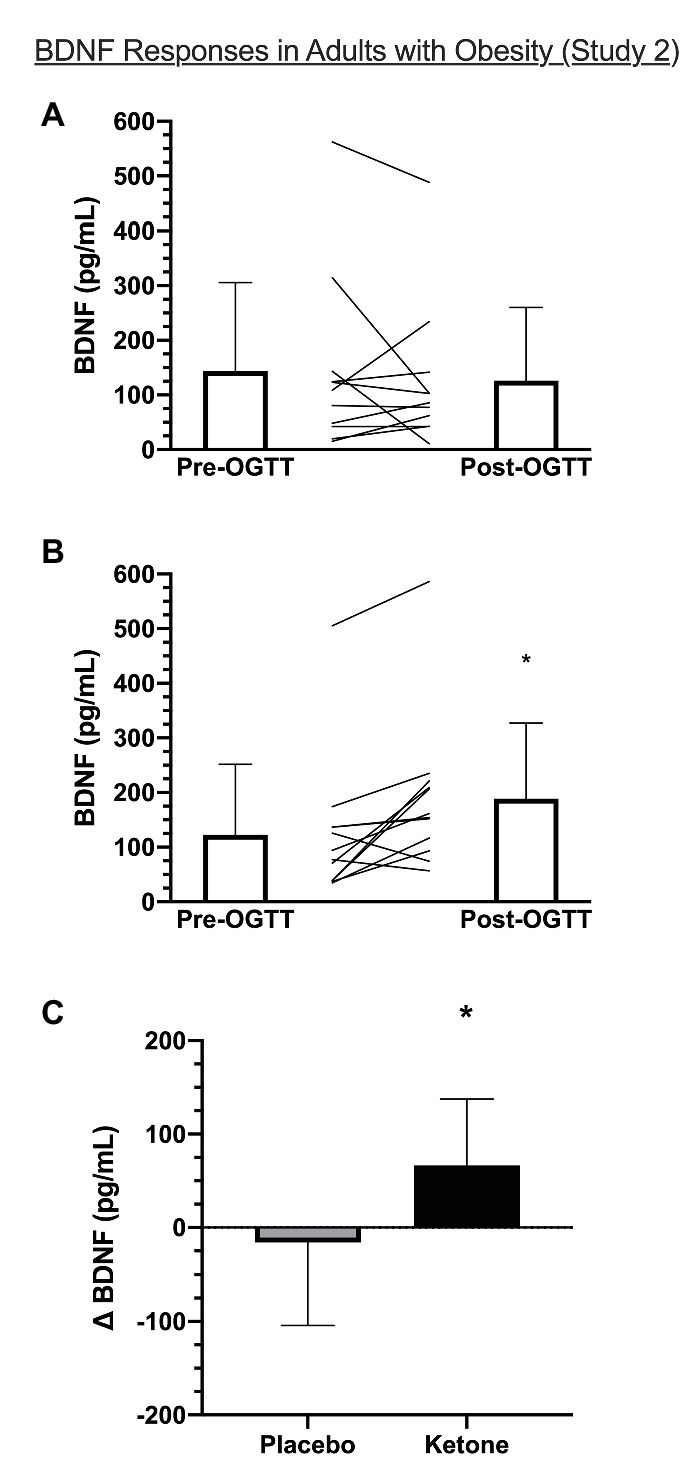
Figure 2.

Plasma BDNF before (pre-OGTT) and 120 min after (post-OGTT) consumption of (A) placebo or (B) ketone + OGTT in OB (Study 2). (C) shows the change in BDNF (post-minus pre-OGTT) within each condition. Bar graphs are group mean ± SD and lines are individual BDNF responses for a given condition. *Significant time × condition interaction, p < 0.05.
