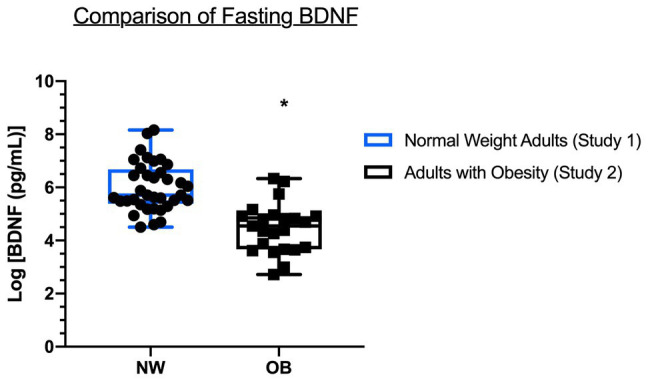
Figure 3.

Comparison of fasting plasma BDNF between NW (Study 1) and OB (Study 2). BDNF data are the average of two fasting measures made at baseline (pre-OGTT) of each condition. Data are log-transformed and presented as mean [max, min] with individual data points. NW = normal weight adults, OB = adults with obesity. *Significantly different compared to NW, p < 0.05.
