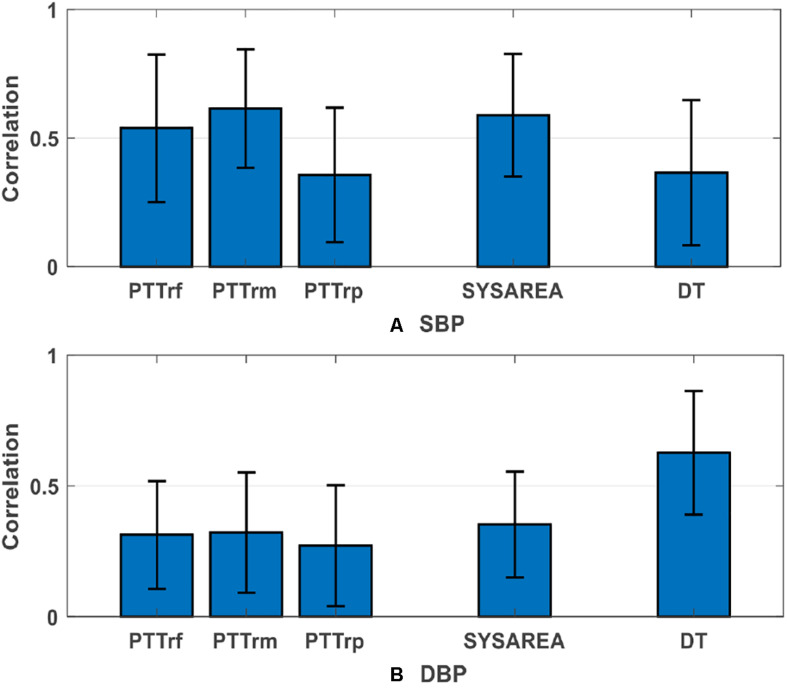
FIGURE 6.
Group average absolute correlations (mean value ± standard deviation) between three PTTs and the PPG features that most relevant to blood pressure versus (A) SBP and (B) DBP. DBP, diastolic blood pressure; SBP, systolic blood pressure; other abbreviations and detailed definitions show in Table 1.

