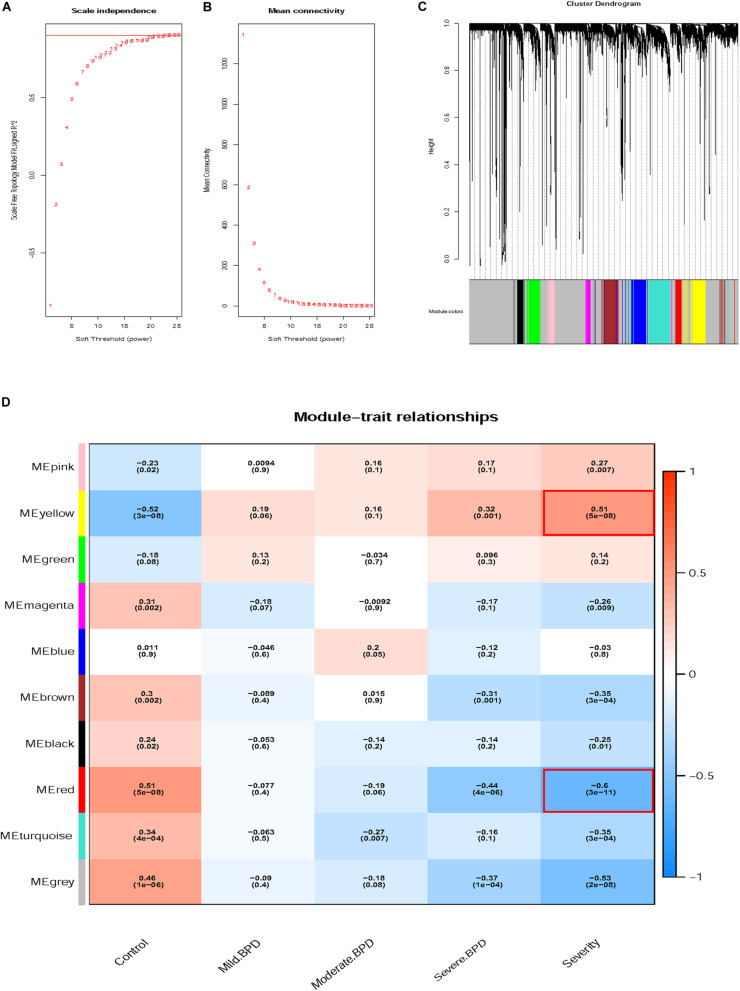
FIGURE 3.
Determination of soft-thresholding power and grouping of genes with similar expression into modules using weighted gene co-expression network analysis (WGCNA). (A) Analysis of the scale-free fit index for soft-thresholding powers (β). (B) Analysis of the mean connectivity for soft-thresholding powers. (C) Dendrogram of clustered genes. (D) Identification of modules associated with clinical information.

