Keywords: fast-food diet, liver fibrosis, nonalcoholic fatty liver disease, nonalcoholic steatohepatitis, obesity, SULF2, sulfatase
Abstract
Sulfatase 2 (SULF2) is a heparan sulfate editing enzyme that regulates the milieu of growth factors and cytokines involved in a variety of cellular processes. We used a murine model of diet-induced steatohepatitis to assess the effect of SULF2 downregulation on the development of nonalcoholic steatohepatitis (NASH) and liver fibrosis. Wild-type B6;129 mice (WT) and Sulf2-knockout B6;129P2-SULF2Gt(PST111)Byg mice (Sulf2-KO) were fed a fast-food diet (FFD) rich in saturated fats, cholesterol, and fructose or a standard chow diet (SC) ad libitum for 9 mo. WT mice on FFD showed a threefold increase in hepatic Sulf2 mRNA expression, and a 2.2-fold increase in hepatic SULF2 protein expression compared with WT mice on SC. Knockout of Sulf2 led to a significant decrease in diet-mediated weight gain and dyslipidemia compared with WT mice on FFD. Knockout of Sulf2 also abrogated diet-induced steatohepatitis and hepatic fibrosis compared with WT mice on FFD. Furthermore, expression levels of the profibrogenic receptors TGFβR2 and PDGFRβ were significantly decreased in Sulf2-KO mice compared with WT mice on FFD. Together, our data suggest that knockout of Sulf2 significantly downregulates dyslipidemia, steatohepatitis, and hepatic fibrosis in a diet-induced mouse model of NAFLD, suggesting that targeting of SULF2 signaling may be a potential therapeutic mechanism in NASH.
NEW & NOTEWORTHY We report for the first time that in wild-type (WT) mice, fast-food diet (FFD) induced a threefold increase in hepatic Sulf2 mRNA and a 2.2-fold increase in sulfatase 2 (SULF2) protein expression compared with WT mice on standard chow diet (SC). We showed that knockout of SULF2 ameliorates FFD-induced obesity, hyperlipidemia, steatohepatitis, and fibrosis. These data, along with work from other laboratories, suggest that SULF2 may be critical to the ability of the liver to progress to nonalcoholic steatohepatitis and fibrosis in conditions of overnutrition.
INTRODUCTION
Nonalcoholic fatty liver disease (NAFLD) is the leading cause of chronic liver disease in Western industrialized countries (26). There are two histological subtypes of NAFLD: simple steatosis [also referred to as nonalcoholic fatty liver (NAFL)], and nonalcoholic steatohepatitis (NASH) (28, 32). NASH is characterized by hepatic inflammation and ballooning that can lead to fibrosis and liver-related complications (28, 32). Progression of NASH has been studied in animal models of diet-induced NAFLD, in which mice fed a high-fat, high-cholesterol diet along with high fructose in their drinking water [collectively referred to as fast-food diet (FFD) or high-fat diet (HFD)] develop metabolic syndrome, insulin resistance, and NASH with progressive fibrosis (2, 4).
Recent studies have suggested that sulfatase 2 (SULF2) plays a role in NASH (24). SULF2 is a 6-O sulfatase in the extracellular matrix (ECM) that desulfates heparan sulfate proteoglycans (HSPGs) (22). In their sulfated state, HSPGs serve as storage sites for several heparin-binding growth factors and cytokines, including fibroblast growth factor (FGF), vascular endothelial growth factor (VEGF), platelet-derived growth factor (PDGF), interleukin 6 (IL-6), transforming growth factor β (TGFβ), and wingless (WNT) (14, 15, 22). SULF2-mediated desulfation of HSPGs releases these growth factors and cytokines from their storage sites to activate downstream signaling pathways (14, 15). SULF2 is important in the regulation of various cellular processes, including cell growth (16), neuron formation (12), and tumorigenesis, (7, 10). Genetically diabetic (ob/ob) mice express markedly increased levels of hepatic SULF2, leading to impaired clearance of very low-density lipoproteins (5). Inhibition of SULF2 using selective antisense oligonucleotides or siRNA improves diabetic dyslipidemia (5, 8, 30). SULF2 has been shown to enhance the autophagic flux crucial to survival and proliferation of liver cancer cells, thus presenting a potential therapeutic target in liver cancer (7).
In this study, we assessed the relationship between FFD and hepatic SULF2 expression, and investigated the effect of downregulation of the Sulf2 gene on diet-induced NASH and liver fibrosis.
MATERIALS AND METHODS
Animals and diets.
B6;129 wild-type (WT) mice from Jackson Laboratory (Bar Harbor, ME) were acclimatized in microisolator cages on a constant 12:12-h light-dark cycle with controlled temperature and humidity starting at 6–8 wk old. Sulf2-KO mice were generated, as previously described via gene trap insertional mutagenesis [B6;129P2-SULF2Gt(PST111)Byg] (23). Homozygous Sulf2-KO mice were crossed with B6;129 WT mice to maintain strain background, and heterozygous offspring from these crosses were then paired to generate the mice used in the experiment. WT offspring and homozygous Sulf2-KO littermates used in this study were identified through PCR genotyping using tail DNA. Animals (six males and six females per group) were randomly assigned to either an FFD to mimic actual Western diets (high in saturated fats, cholesterol, and fructose; AIN-76 Western Diet) (4, 13) or a standard chow diet (SC) (5% fat, 140 ppm cholesterol; PicoLab Rodent Diet) ad libitum for 9 mo. In addition, high-fructose corn syrup (42 g/L) was administered in the drinking water of mice on the FFD, whereas mice on the SC diet received tap water (4). At 9 mo, mice were weighed and euthanized by carbon dioxide inhalation. Blood was drawn by cardiac puncture for biochemistry and lipid measurements. The liver was excised, weighed, and apportioned for RNA/DNA extraction and flash-frozen or preserved in 10% buffered formalin for tissue histochemistry. The care and use of the animals for this study, as well as all animal procedures performed, were reviewed and approved by the Institutional Animal Care and Use Committee at the Mayo Clinic.
Anthropometric measures.
Body weight was measured monthly. Lean and fat mass were quantified every 3 mo and at the end of study using quantitative nuclear magnetic resonance (LaTheta, EchoMRI, Houston, TX). For each mouse, lean and fat mass were normalized relative to body weight.
Evaluation of insulin sensitivity.
Insulin sensitivity was estimated by the glucose-tolerance test (GTT), intraperitoneal insulin-tolerance test (ITT), and the homeostasis model assessment of insulin-resistance (HOMA-IR) index. GTT was assessed at the end of the study in 6-h fasted mice by measuring serum glucose concentrations before and after an intraperitoneal bolus of glucose (1.0 g/kg). Using a blood glucose monitor (Assure 4, Arkray, Edina, MN), we measured serum glucose at the following time points after the glucose bolus: 15, 30, 60, 90, and 120 min. After a recovery period of at least 3 days, an intraperitoneal insulin tolerance test was conducted following a 4-h fast by measuring serum glucose concentrations before and 15, 30, 45, 60, and 90 min after an intraperitoneal bolus of insulin (0.05 mU/g). Values for calculation of HOMA-IR index were obtained after a 12-h overnight fast by measuring serum glucose using a glucose monitor and analyzing serum insulin levels using a commercially available ELISA kit (EZRMI-13K, Millipore, Billerica, MA). HOMA-IR index was calculated by multiplying the fasting insulin (µIU/mL) by fasting glucose concentration (mg/dL) and dividing the product by 405.
Biochemistry and lipid measurements.
Serum alanine aminotransferase (ALT) levels and total cholesterol were measured using standardized and automated procedures of the diagnostic laboratory at the Mayo Clinic. Serum-free fatty acids, high-density lipoproteins (HDL), and triglycerides were assessed following an overnight fast. Commercial ELISA kits were used to measure levels of insulin and growth hormone (EZRMI-13K and EZRMGH-45K, respectively; Millipore, Billerica, MA) following the manufacturer’s instructions.
Histology, immunohistochemistry, and digital image analysis.
All histology and immunostaining of tissue sections were carried out by the Pathology Research Core facility of Mayo Clinic (Rochester, MN). Briefly, deparaffinized, hydrated serial sections (4–6 μm thick) of liver were stained with hematoxylin and eosin (HE), Masson’s trichrome and picrosirius red using standardized protocols. The sections were also analyzed for apoptosis using TUNEL staining. Stained tissue sections were analyzed for evidence of NASH and fibrosis by a pathologist (T. Mounajjed), who was blinded to the study conditions. The classification of Brunt et al. (3) was used to assign numerical scores to steatosis, lobular inflammation, ballooning, and fibrosis. Quantitative analysis of collagen deposition was based on digitally acquired images of picrosirius red-stained slides. Lipid size and percent lipid staining was also assayed using sections of flash-frozen liver tissue stained with Oil Red O (ORO). Stained sections were viewed under phase microscope, and ImageJ software was used to quantitate lipid size and percent staining.
Western blot analyses.
Total protein from frozen tissue samples was extracted in lysis buffer (FNN0011; Invitrogen, CA). Protease inhibitor cocktail set III and phosphatase inhibitor (539134 and 524627, respectively; Calbiochem, San Diego, CA) were added to the lysis buffer immediately before use. Equal quantities of protein (20 ng) were separated by electrophoresis on 10% SDS/PAGE gels and transferred to PVDF membrane. Blots were probed with primary antibodies against SULF2 (sc-68435; Santa Cruz Biotechnology, Santa Cruz, CA); TGFβR2 (ab78419; Abcam, Cambridge, MA); PDGFRβ (no. 3169; Cell Signaling Technology, Danvers, MA); α-smooth muscle actin (α-SMA; A5228, Sigma-Aldrich, St. Louis, MO) and α-tubulin (ab18251; Abcam, Cambridge, MA). Protein bands were visualized using Pierce enhanced chemiluminescent substrate (32106; Thermo Scientific, Rockford, IL).
RT-PCR analysis.
Total RNA was isolated from frozen liver tissue or cell pellets using the RNeasy Plus kit (Qiagen, Valencia, CA), followed by reverse transcription into cDNA using high-capacity cDNA reverse transcription kit (Applied Biosystems, Foster City, CA). Quantitative RT-PCR (qRT-PCR) was performed using ABI TaqMan assays in an ABI 7300 system. For qRT-PCR, the following primers were obtained from Applied Biosystems: 18S rRNA, SULF2, TGFβ1, TGFβR2, PDGFβ, PDGFRβ, Collagen 1α1, Interleukin-1 β (IL1β) and its receptor IL1βR1, IL6 and its receptor IL6R, and tumor necrosis factor-α receptor (TNFR1). Real-time PCR for α-SMA, TNF-α, and tissue inhibitor of metalloproteinase 1 (TIMP1) was performed on a Bio-Rad iCycler using LightCycler 480 SYBR Green 1 Master Mix (Roche, Indianapolis, IN). Primers were generated through software programs available from the Universal Probe Library, Roche, or the National Center for Biotechnology Information or were commercially available through Applied Biosystems. The mRNA level in each sample was normalized by comparison to 18S rRNA level in the same sample.
Statistical analysis.
All animal data represent at least three independent experiments and are presented as means ± SE. Differences between groups were compared using a Student’s t test or one-way ANOVA. A P value <0.05 was considered significant.
In vitro assays of HepG2 cells.
HepG2 cells transfected with short hairpin RNA (shRNA) against Sulf2 (14) or control scrambled shRNA were plated on a 22 × 22-mm coverslip for 24 h in DMEM containing 10% FBS. Cells were incubated at 37°C overnight, followed by incubation with DMEM containing 400 µM of palmitic acid (Sigma P0500–2.5G) with 1% BSA or vehicle (diluent of palmitic acid) for 8 h.
BODIPY 493/503 staining of HepG2 cells.
BODIPY 493/503 (1 mg/ml) (4,4-difluoro-1,3,5,7,8-pentamethyl-4-bora-3a,4a-diaza-s-indacene) stock solution was prepared by dissolving 10 mg BODIPY 493/503 in 10 mL ethanol (18). HepG2 cells expressing shRNA targeting Sulf2 or scrambled shRNA and treated with palmitic acid or vehicle were fixed with 3% paraformaldehyde. Cells were then stained with 5 µg/mL BODIPY 493/503 in microscopy buffer containing 400 mL PBS, 5 g BSA, 0.5 g saponin, and 0.5 mL of 20% (wt/vol) sodium azide for 1 h at room temperature. Cells were washed with PBS and stained with DAPI nucleic acid stain before being mounted on a glass slide using ProLong Gold antifade reagent. Cells were visualized with Zeiss 710 confocal microscope (Oberkochen, Germany). DAPI fluorescence was determined at excitation and emission wavelengths of 358 nm and 461 nm, respectively. BODIPY was measured at excitation and emission wavelengths of 480 nm and 515 nm, respectively. Average size of lipid droplets and the number of droplets per area were assessed with ImageJ software.
RESULTS
FFD increases SULF2 expression in WT mice.
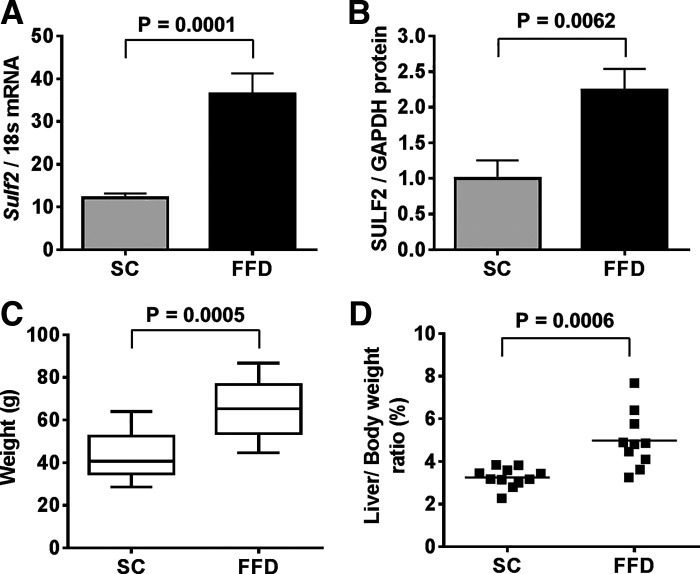
Initially, we looked for diet-related changes in SULF2 expression in mouse liver by real-time PCR and Western blot analysis. Relative to WT mice on SC, there was a threefold increase in Sulf2 mRNA in WT mice on FFD (Fig. 1A). In addition, there was a 2.2-fold higher expression of SULF2 protein in WT mice on FFD compared with WT mice on SC (Fig. 1B). As expected, WT mice on FFD showed a significant increase in body weight (Fig. 1C) and liver-to-body weight ratio (Fig. 1D) compared with WT mice on SC.
Fig. 1.
Fast-food diet (FFD) increases sulfatase 2 (SULF2) expression. RT-PCR of hepatic Sulf2 mRNA expression normalized to 18s rRNA in wild-type (WT) mice fed standard chow diet (SC) or FFD for 9 mo (A). Western blot analysis of hepatic SULF2 protein expression normalized to GAPDH in WT mice fed SC or FFD (B). Total body weight (C) and liver-to-body weight ratio (D) of WT mice after 9 mo on ad libitum feeding with SC or FFD. Data shown represent 9–12 mice per group.
Knockout of SULF2 ameliorates FFD-induced weight gain and insulin resistance.
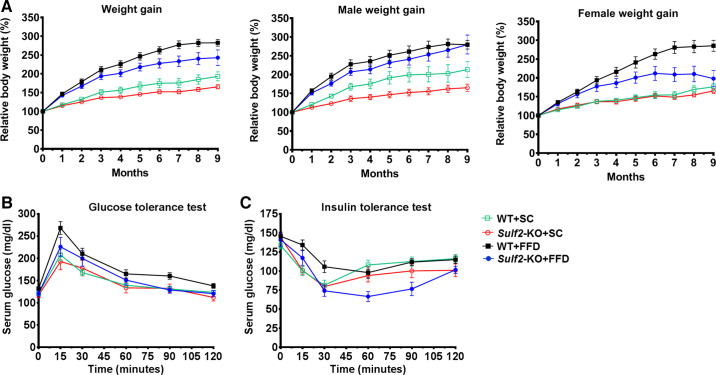
Having assessed diet-related increase in SULF2 expression in WT mice, we next examined the effect of Sulf2-KO on diet-related changes in physiology and biochemistry. Whether on SC diet or FFD, Sulf2-KO mice gained significantly less weight than WT mice on a similar diet (Fig. 2A and Table 1). When the data were subcategorized by sex, weight gain followed a similar trend in males and females, with the exception that weight gain in all females (whether WT or Sulf2-KO) on SC diet was similar but appeared more varied in males (Fig. 2A; male weight gain and female weight gain). While WT mice on FFD showed a trend toward increased insulin resistance as determined by GTT (Fig. 2B) and ITT (Fig. 2C), these differences did not reach statistical significance compared with the other groups. After 9 mo of feeding however, fasting glucose level and HOMA-IR were significantly higher in WT mice on FFD compared with Sulf2-KO mice on the same diet, and the levels of fasting insulin among the two groups on FFD were notably different and showed a trend toward statistical significance (Table 1).
Fig. 2.
Weight gain and insulin homeostasis in mice. A: weight gain in wild-type (WT) mice and Sulf2-knockout (KO) mice on standard chow diet (SC) or fast-food diet (FFD) over the 9-mo study period. Data were further subcategorized by male and female sex and analyzed. Glucose-tolerance test (B) and insulin-tolerance test (C) in WT mice and Sulf2-KO mice on SC or FFD. Data shown represent 11 or 12 mice per group, or 5 or 6 mice per group when subcategorized by sex.
Table 1.
Anthropometric and biochemical measurements of WT and Sulf2-KO mice fed either standard chow or fast food diet
| Standard Chow Diet |
Fast-Food Diet |
|||||
|---|---|---|---|---|---|---|
| Parameters | WT (n = 11) |
Sulf2-KO (n = 12) |
WT (n = 12) |
Sulf2-KO (n = 11) |
P Value* | P Value** |
| Initial weight, g | 22.2 ± 1.1 | 17.7 ± 0.9 | 21.5 ± 1.4 | 17.7 ± 0.7 | 0.7 | 0.02 |
| Final weight, g | 43.1 ± 3.7 | 29.1 ± 1.5 | 65.3 ± 3.3 | 44.7 ± 4.7 | <0.0001 | 0.0002 |
| Percent weight gain, % | 93.1 ± 11.9 | 65.3 ± 5.5 | 207.6 ± 13.0 | 144.7 ± 19.7 | <0.0001 | 0.002 |
| Liver-to-body wt ratio, % | 3.2 ± 0.1 | 3.2 ± 0.2 | 4.8 ± 0.4 | 5.6 ± 0.7 | 0.01 | 0.2 |
| Adipose-to-body wt ratio, % | 4.7 ± 0.4 | 3.1 ± 0.4 | 7.3 ± 0.9 | 7.6 ± 1.1 | 0.02 | 0.8 |
| Glucose, mg/dL | 144.7 ± 6.2 | 134.3 ± 5.4 | 209.7 ± 10.3 | 182.0 ± 3.6 | <0.0001 | 0.01 |
| Insulin, IU/mL | 21.4 ± 4.4 | 20.2 ± 3.5 | 74.1 ± 12.7 | 48.9 ± 12.0 | <0.0001 | 0.06 |
| HOMA-IR, % | 7.4 ± 1.4 | 6.8 ± 1.3 | 38.2 ± 6.6 | 22.0 ± 5.4 | <0.0001 | 0.01 |
| GH, ng/mL | 5.6 ± 0.2 | 9.8 ± 0.8 | 1.8 ± 0.3 | 5.8 ± 0.6 | <0.0001 | <0.0001 |
Data are presented as means ± SE; n, number of mice. GH, growth hormone; HOMA-IR, homeostasis model assessment of insulin resistance.
P value of WT mice fed standard chow diet vs. fast-food diet.
P value of WT vs. Sulf2-KO mice fed fast-food diet.
Knockout of SULF2 improves lipid homeostasis.
To determine whether SULF2 knockout alters liver steatosis, we performed lipid staining of sectioned liver tissue and measured serum cholesterol and triglyceride levels. All mice on SC showed similar levels of steatosis, as seen in representative lipid-stained histology slides (Fig. 3A, top) which were quantitated and compared (Fig. 3B). Sulf2-KO mice on FFD showed lower lipid content compared with WT mice on the same diet (Fig. 3A, bottom), although the difference between quantitated ORO-red stained areas did not reach statistical significance (Fig. 3B). Triglyceride levels were lower in Sulf2-KO mice on SC compared with WT mice on SC but were similar in mice on FFD (Fig. 3C). Total cholesterol (Fig. 3D) and LDL cholesterol (Fig. 3E) were significantly lower in Sulf2-KO mice compared with WT mice on FFD, with similar trends persisting when the data were subcategorized by sex.
Fig. 3.
Fast-food diet (FFD)-induced dyslipidemia is ameliorated by sulfatase 2 (SULF2) knockout. A: frozen liver sections were stained with Oil Red O (ORO) stain. B: quantification of lipid staining using ImageJ software showed a trend toward decreased hepatic lipid deposition in Sulf2-knockout (KO) mice on FFD, compared with wild-type (WT) mice on the same diet. Triglyceride level (C), total cholesterol (D), and low-density lipoprotein (LDL) cholesterol (E) in WT and Sulf2-KO mice on SC or FFD. Data for total and LDL cholesterol are further subcategorized by male and female sex and analyzed. Data shown represent 9–12 mice per group or 4–6 mice per group when subcategorized by sex.
Lipid accumulation is decreased by shRNA-mediated SULF2 knockdown in HepG2 cells exposed to palmitic acid.
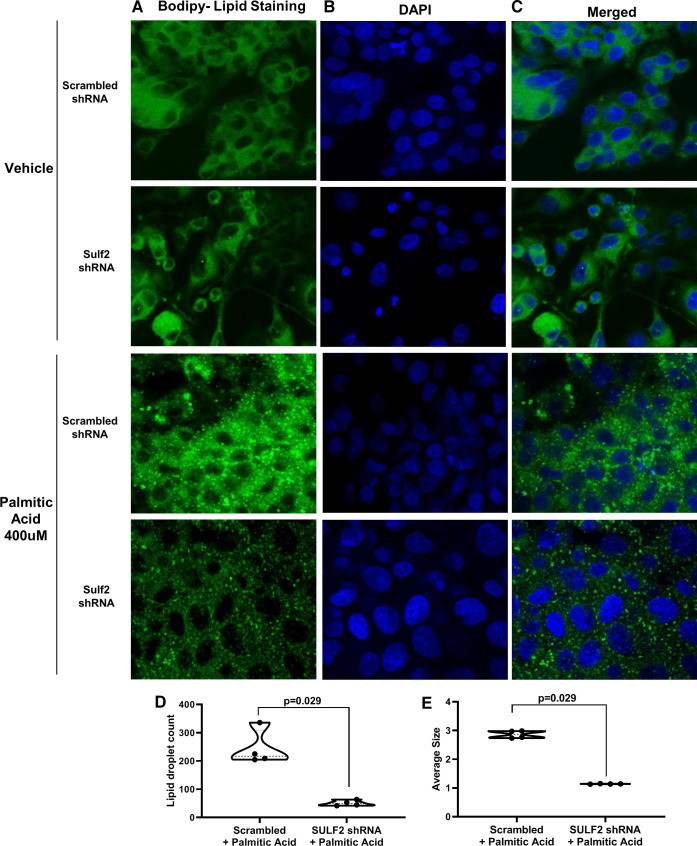
To further explore the effect of SULF2 knockdown in lipid homeostasis, HepG2 cells expressing Sulf2 shRNA or scrambled shRNA were incubated with 400 µM of palmitic acid or vehicle. Visualization of BODIPY-stained samples by fluorescent microscopy showed that cells incubated with vehicle showed similar lipid staining of Sulf2 shRNA versus scrambled shRNA samples (Fig. 4, A–C, top two rows). Challenging cells with 400 µM of palmitic acid (Fig. 4, A–C, bottom two rows) resulted in significant lipid accumulation in cells expressing scrambled shRNA but not in those expressing Sulf2 shRNA. Quantitation with ImageJ software showed that Sulf2 shRNA-expressing cells showed decreased lipid size compared with scrambled control samples after palmitic acid exposure (1.1 vs. 2.9; P = 0.029) (Fig. 4E). Lipid droplet count was also reduced in Sulf2 shRNA-expressing cells compared with cells with scrambled shRNA control (51 vs. 244; P = 0.029) after treatment with palmitic acid (Fig. 4D).
Fig. 4.
Short-hairpin RNA (shRNA)-mediated knockdown of sulfatase 2 (SULF2) ameliorates lipid accumulation in HepG2 cells. Lipid accumulation was assessed in HepG2 cells expressing shRNA targeting Sulf2 or scrambled shRNA, followed by incubation with 400 µM of palmitic acid or vehicle. BODIPY 493/503 lipid stain (A, green) and DAPI nucleic acid stain (B, blue) were assessed using confocal microscopy. Images of BODIPY and DAPI staining were merged (C). The number of lipid droplets per area (D) and average size of lipid droplets (E) in palmitic acid-treated HepG2 cells expressing scrambled vs. Sulf2 shRNA were assessed using ImageJ software.
Knockout of SULF2 abrogates FFD-induced liver inflammation.
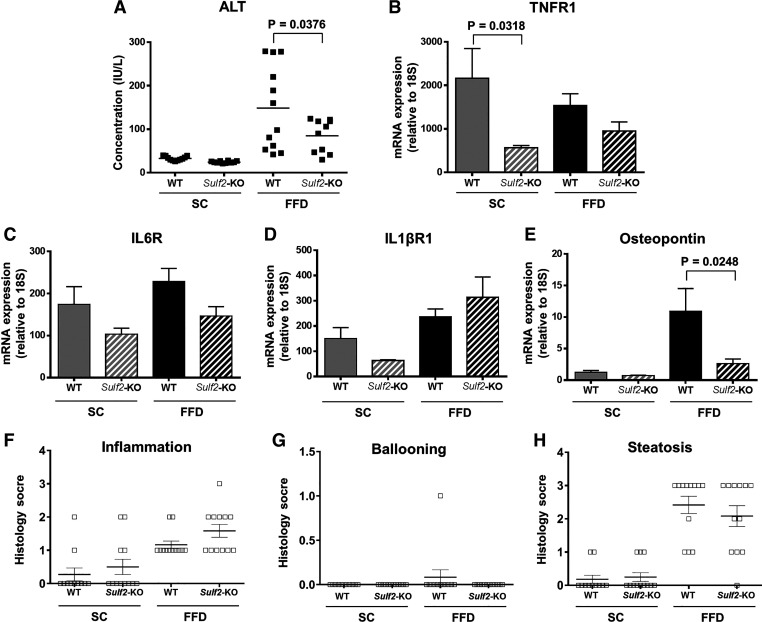
Next, we examined the effect of Sulf2-KO on markers of hepatic inflammation. All mice on SC diet showed similar levels of serum ALT (Fig. 5A). In contrast, WT mice on FFD showed increased serum ALT, with knockout of Sulf2 resulting in a significant decrease in ALT compared with WT mice. To further examine the effect of Sulf2-KO on hepatic inflammation, we assessed hepatic mRNA levels of inflammatory cytokines TNF-α, IL6, and IL1β, and their cognate receptors TNFR1, IL6R, and IL1βR1. There was no difference in the mRNA levels of the above-mentioned cytokines between WT and Sulf2-KO mice on a similar diet (data not shown). However, when the hepatic mRNA levels of the cytokine cognate receptors TNFR1 and IL6R were assessed, a marked decrease was seen in Sulf2-KO mice on FFD compared with WT mice on the same diet (Fig. 5, B and C). The hepatic mRNA level of IL1βR1 (Fig. 5D) was increased in Sulf2-KO mice compared with WT mice on FFD, but the difference did not reach statistical significance. Moreover, Sulf2-KO mice on FFD expressed significantly lower hepatic mRNA levels of osteopontin, a well-known marker of liver inflammation, compared with WT mice on the same diet (Fig. 5E). Despite the Sulf2-KO-associated decrease in inflammation, as evidenced by decreased ALT levels and the above-mentioned cytokine pathways, histological scores for inflammation, ballooning, and steatosis were similar in WT versus Sulf2-KO mice on FFD (Fig. 5, F–H).
Fig. 5.
Sulfatase 2 (SULF2) knockout (KO) decreases fast-food diet (FFD)-induced liver inflammation. A: serum alanine aminotransferase (ALT) levels in wild-type (WT) and Sulf2-KO mice on standard chow diet (SC) or FFD. RT-PCR of hepatic mRNA expression of TNFR1 (B), IL6R (C), IL1βR1 (D), and osteopontin (E) in WT and Sulf2-KO mice fed SC or FFD. The mRNA expression of each gene was normalized to 18s rRNA. Histological assessment of inflammation (F), ballooning (G), and steatosis (H) in WT vs. Sulf2-KO mice fed SC or FFD in hematoxylin and eosin-stained liver sections. Data shown represent 9–12 mice per group.
SULF2 knockout improves FFD-induced apoptosis and liver fibrosis.
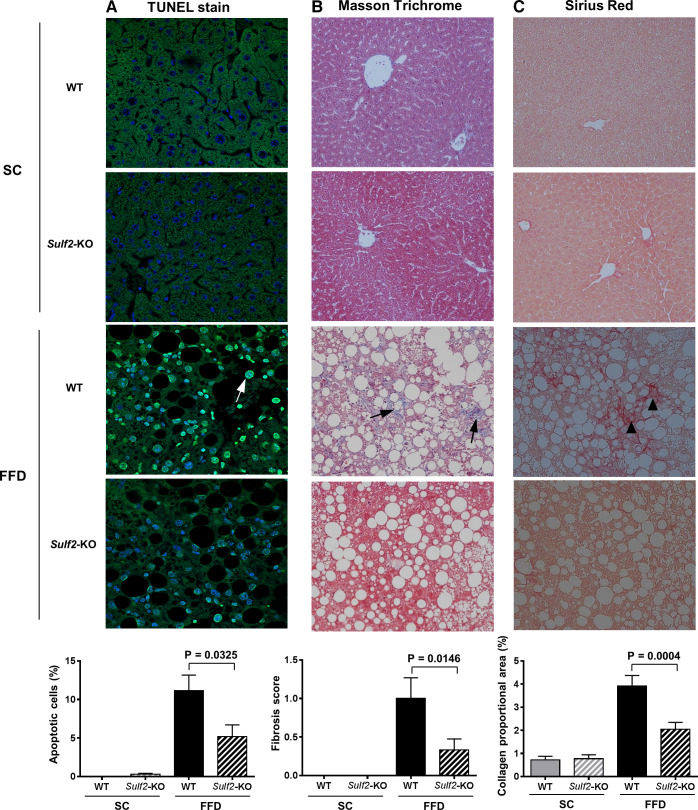
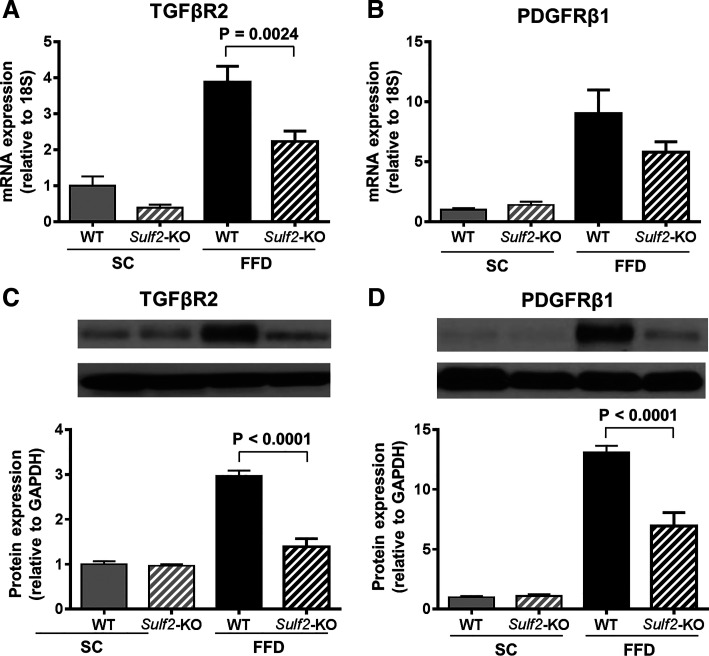
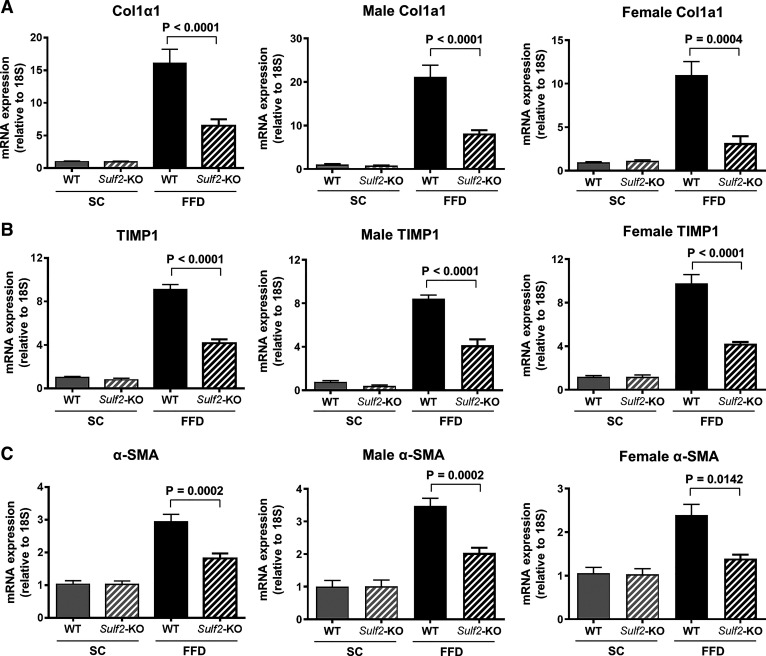
TUNEL assay of sectioned liver tissue showed that FFD increased hepatocyte apoptosis in WT mice but not in Sulf2-KO mice (Fig. 6A). To determine the effect of SULF2 on diet-induced hepatic fibrosis, we performed Masson trichrome staining of mouse liver tissue. Sulf2-KO and WT mice on SC demonstrated minimal fibrosis (Fig. 6B). In contrast, WT mice on FFD showed significant hepatic fibrosis, and knockout of Sulf2 resulted in a 60% decrease in fibrosis compared with WT mice despite feeding on an FFD (fibrosis score 0.4 vs. 1.0; P = 0.0148) (Fig. 6B). Additional assessment of fibrosis through quantitation of collagen deposition in Sirius red-stained liver sections showed that Sulf2-KO mice on an FFD had significantly lower collagen proportional area compared with WT mice on an FFD (3.9% vs. 2.0%; P = 0.0004) (Fig. 6C). Finally, the effect of Sulf2 knockout on TGFβ and PDGF pathways, known to be major signaling pathways regulating liver fibrogenesis, was assessed. All mice on SC diet showed similar hepatic mRNA and protein expression of TGFβR2 and PDGFRβ. Knockout of Sulf2 was associated with significantly lower mRNA level of TGFβR2 (Fig. 7A) compared with WT mice on an FFD. The hepatic mRNA level of PDGFRβ1 was also decreased in Sulf2-KO mice on an FFD compared with WT mice on the same diet (Fig. 7B). These changes were accompanied by a corresponding decrease in the hepatic protein levels of TGFβR2 (Fig. 7C) and PDGFRβ1 (Fig. 7D) in Sulf2-KO mice on an FFD compared with WT mice on an FFD. Furthermore, the mRNA expression levels of the profibrogenic TGFβR2- and PDGFRβ1-target genes Collagen 1α1, TIMP1, and α-SMA were significantly lower in Sulf2-KO versus WT mice on FFD (Fig. 8, A–C), with similar trends seen in male and female mice.
Fig. 6.
Sulfatase 2 (SULF2) decreases fast-food diet (FFD)-induced apoptosis and liver fibrosis. Sections of mouse liver tissue were stained to assess the degree of apoptosis and fibrosis in wild-type (WT) and Sulf2-KO mice on SC or FFD. A: TUNEL staining of liver tissue sections (4–7 mice per group on SC and 9–11 mice per group on FFD) to determine apoptosis. B: Masson’s trichrome-staining of liver tissue sections (11–12 mice per group) to assess liver fibrosis. C: Picrosirius red-stained liver tissue sections (11–12 mice per group) to determine collagen deposition. Quantification of stained area is shown underneath each group of slides.
Fig. 7.
Knockout (KO) of sulfatase 2 (SULF2) downregulates profibrogenic signaling. Hepatic mRNA levels of the profibrogenic genes TGFβR2 (A) and PDGFRβ (B) were assessed by quantitative RT-PCR in wild-type (WT) and Sulf2-KO mice on standard chow diet (SC) or fast food diet (FFD) and normalized to 18s rRNA in the same sample (8–12 mice/group). Protein levels of TGFβR2 (C) and PDGFRβ (D) were also assessed via Western blot analysis (7 mice per group). Representative Western blots depicting the protein of interest (top band) and GAPDH (bottom band) and their quantitation with ImageJ are shown.
Fig. 8.
TGFβR2- and PDGFRβ1-target genes are downregulated by sulfatase 2 (SULF2) knockout. Hepatic mRNA expression levels of Collagen 1α1 (A), TIMP1 (B), and α-SMA (C) were determined by quantitative RT-PCR in wild-type (WT) and Sulf2-KO mice on standard chow diet (SC) or fast-food diet (FFD) and normalized to 18s rRNA. Data were further subcategorized by sex and analyzed. Data shown represent 9–12 mice per group or 5 or 6 mice per group when subcategorized by sex.
DISCUSSION
We provide data to demonstrate that FFD-induced obesity in WT mice is associated with increased expression of Sulf2. We also show that knockout of Sulf2 abrogates FFD-induced obesity, hyperlipidemia, insulin resistance, and steatohepatitis. In addition, knockout of Sulf2 inhibits FFD-mediated progression to hepatic fibrosis. These data, along with work from other laboratories (19, 21, 28), suggest that SULF2 may be critical to the ability of liver to develop NASH and hepatic fibrosis in conditions of overnutrition.
In this study, we observed a two- to threefold increase in Sulf2 mRNA and protein expression when WT mice were fed ad libitum with FFD, compared with SC diet. Diet-mediated changes in hepatic physiology and biochemistry have been well described in a number of animal models of NAFLD (2, 25); however, no studies have, to date, demonstrated a diet-mediated increase in SULF2 expression in mice. It has been proposed that increased advanced glycation end products (AGEs), hypoadiponectinemia, and insulin resistance that occur in obesity and T2DM upregulate hepatic Sulf2 and impair HSPG-mediated TRL clearance (9). As such, obesity and metabolic syndrome appears to upregulate SULF2 expression, as demonstrated in our study where WT mice fed FFD showed increased SULF2 compared with WT mice fed SC.
Concomitantly, SULF2 appears to predispose to obesity and its metabolic complications. Increased SULF2 expression was found to strongly predispose obese T2DM human subjects to fasting and postprandial triglyceridemia (9). In our mouse model, knockout of Sulf2 decreased weight gain and improved dyslipidemia and insulin resistance despite feeding on FFD. Similar to our in vivo model, shRNA-mediated knockdown of Sulf2 in HepG2 cells resulted in decreased lipid accumulation after incubation with palmitic acid, compared with cells treated with scrambled shRNA. In humans, the SULF2 rs2281279 (A > G) SNP was associated with lower plasma triglyceride levels (9). These results suggest a possible stimulatory effect between SULF2 and components of the metabolic syndrome, and vice versa.
To assess the effect of SULF2 downregulation on the development of NASH and liver fibrosis, we identified WT and homozygous Sulf2-KO littermates and maintained them on SC or FFD. As expected, WT mice on FFD showed increased obesity, hyperlipidemia, and insulin resistance compared with WT mice on SC. Osteopontin, known to be involved in adipose tissue expansion and liver steatosis (11, 17) was also increased in WT mice on FFD. WT mice on FFD also demonstrated hepatic inflammation evidenced by increased ALT and increased mRNA levels of the inflammatory cytokine receptors TNFR1 and IL6R, as well as increased apoptosis. Knockout of Sulf2 ameliorated these physiological and biochemical changes despite feeding on FFD, resulting in decreased obesity, hyperlipidemia, and insulin resistance compared with WT mice. Moreover, Sulf2-KO mice demonstrated decreased osteopontin, hepatic inflammation, and apoptosis compared with WT mice on FFD.
WT and Sulf2-KO mice were continued on SC or FFD for 9 mo to assess the effect of Sulf2-KO on fibrosis. In line with progressive fibrosis that can be seen in NASH, WT mice on an FFD showed increased collagen deposition and expression of the profibrogenic receptors TGFβR2 and PDGFRβ1. The role of these profibrogenic pathways in progressive NASH and fibrosis have been previously established (1, 6, 20, 29, 31). Knockout of Sulf2 abrogated collagen deposition and downregulated TGFβR2 and PDGFRβ1 expression compared with WT mice on an FFD. In addition, the mRNA expression levels of TGFβR2- and PDGFRβ1-target genes, Collagen 1α1, TIMP1, and α-SMA were significantly downregulated in Sulf2-KO on FFD compared with WT mice on the same diet. These observations were seen in both male and female mice.
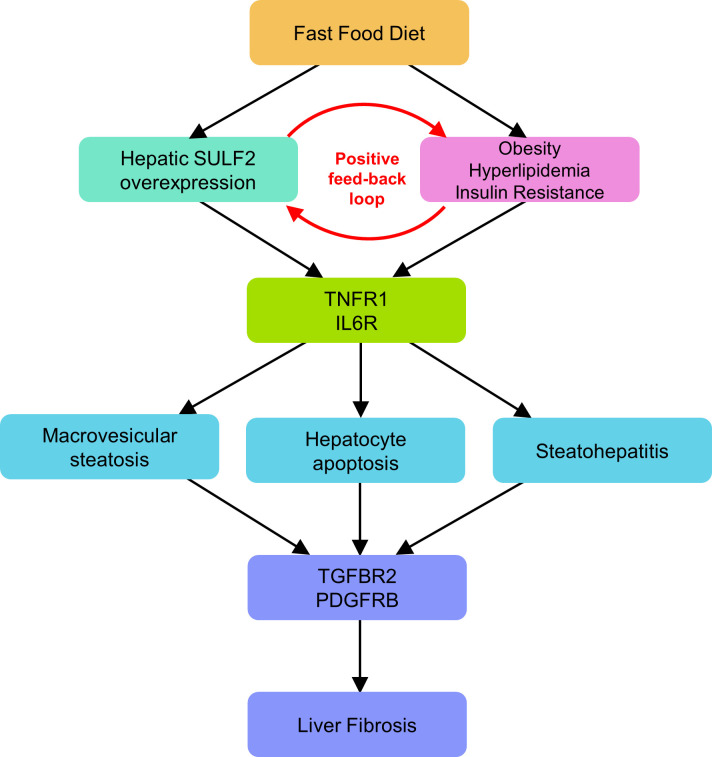
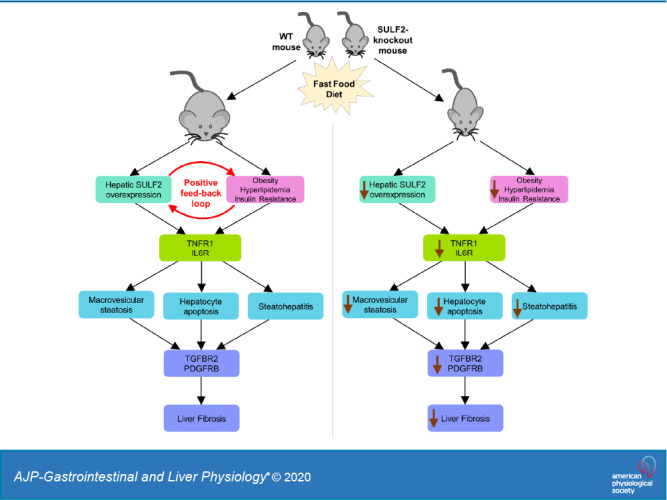
The findings we report in this article provide a novel link between FFD, SULF2, and development of NASH and fibrosis. Our present work and previous work by others (19, 27) suggest a model in which conditions of overnutrition favor a positive feedback loop involving SULF2 on one hand and obesity and its metabolic consequences on the other, ultimately leading to steatohepatitis and fibrosis through previously established proinflammatory and profibrogenic pathways (Fig. 9). The FFD, which predisposes to obesity, hyperlipidemia, and insulin resistance, also creates conditions that favor the upregulation of SULF2. Increased SULF2 may further facilitate obesity, hyperlipidemia, and insulin resistance. Over time, hepatic inflammation and fibrosis may develop through mechanisms that involve modulation of TGFβR2 and PDGFRβ signaling. The proposed model is supported by the increased SULF2 expression in WT mice on an FFD, the inhibition of weight gain in Sulf2-KO mice on FFD, the decreased insulin resistance and dyslipidemia and the eventual decrease in steatohepatitis and fibrosis in Sulf2-KO mice on an FFD.
Fig. 9.
Proposed model of positive feedback loop involving sulfatase 2 (SULF2), obesity, and metabolic syndrome in conditions of overnutrition. Fast-food diet predisposes mice to obesity and its metabolic complications (hyperlipidemia and insulin resistance) and creates conditions that favor upregulation of SULF2. Increased SULF2 further propagates obesity, hyperlipidemia, and insulin resistance in a positive feedback loop. Hepatic inflammation and fibrosis develop over time through a SULF2-dependent mechanism involving modulation of TGFβR2 and PDGFRβ1 signaling.
In conclusion, knockout of Sulf2 protects against diet-mediated steatohepatitis and progression to fibrosis. It is unclear whether Sulf2-KO abrogates NASH and fibrosis indirectly through inhibiting the development of obesity, or through direct mechanisms that do not involve obesity. Our findings set the stage for further studies to delineate whether the effects of Sulf2-KO on NASH and fibrosis are direct or indirect. Future studies could use pair-feeding or cross-breeding of Sulf2 knockouts into an appetite-defective, hyperphagic mouse to eliminate resistance to obesity. These studies would shed further light on the role of SULF2 signaling in NASH and the potential applicability of SULF2 downregulation as therapy for NASH and progressive fibrosis.
GRANTS
This work was supported by the National Institutes of Health Grants CA100882, CA128633, CA165076, and CA210964 (to L. R. Roberts); the Mayo Clinic Center for Cell Signaling in Gastroenterology Grant DK084567; the Mayo Clinic Cancer Center Grants CA15083; an American Gastroenterological Association Foundation for Digestive Health and Nutrition Bridging Grant (to L. R. Roberts); and the Mayo Foundation.
DISCLOSURES
No conflicts of interest, financial or otherwise, are declared by the authors.
AUTHOR CONTRIBUTIONS
T.H.K., T.A.W., G.J.G., N.K.L., M.R.C., and L.R.R. conceived and designed research; T.H.K., B.A.B., N.A.C., C.H., C.D.M., A.M.S., S.H., C.M., A.K., T.M., T.A.W., and L.R.R. performed experiments; T.H.K., B.A.B., N.A.C., C.H., C.D.M., A.M.S., S.H., C.M., and L.R.R. analyzed data; T.H.K., B.A.B., F.Z.A., N.A.C., C.H., C.D.M., A.M.S., S.H., C.M., and L.R.R. interpreted results of experiments; T.H.K., B.A.B., N.A.C., C.D.M., S.H., C.M., and L.R.R. prepared figures; T.H.K., B.A.B., F.Z.A., N.A.C., and L.R.R. edited and revised manuscript; B.A.B., F.Z.A., C.H., C.D.M., A.M.S., S.H., and C.M. drafted manuscript; B.A.B., F.Z.A., N.A.C., A.K., T.M., T.A.W., G.J.G., N.K.L., M.R.C., and L.R.R. approved final version of manuscript.
ACKNOWLEDGMENTS
We thank Jennifer Rud for secretarial assistance and Eugene Krueger for technical assistance.
REFERENCES
- 1.Arrese M, Cabrera D, Kalergis AM, Feldstein AE. Innate immunity and inflammation in NAFLD/NASH. Dig Dis Sci 61: 1294–1303, 2016. doi: 10.1007/s10620-016-4049-x. [DOI] [PMC free article] [PubMed] [Google Scholar]
- 2.Asgharpour A, Cazanave SC, Pacana T, Seneshaw M, Vincent R, Banini BA, Kumar DP, Daita K, Min HK, Mirshahi F, Bedossa P, Sun X, Hoshida Y, Koduru SV, Contaifer D Jr, Warncke UO, Wijesinghe DS, Sanyal AJ. A diet-induced animal model of non-alcoholic fatty liver disease and hepatocellular cancer. J Hepatol 65: 579–588, 2016. doi: 10.1016/j.jhep.2016.05.005. [DOI] [PMC free article] [PubMed] [Google Scholar]
- 3.Brunt EM, Janney CG, Di Bisceglie AM, Neuschwander-Tetri BA, Bacon BR. Nonalcoholic steatohepatitis: a proposal for grading and staging the histological lesions. Am J Gastroenterol 94: 2467–2474, 1999. doi: 10.1111/j.1572-0241.1999.01377.x. [DOI] [PubMed] [Google Scholar]
- 4.Charlton M, Krishnan A, Viker K, Sanderson S, Cazanave S, McConico A, Masuoko H, Gores G. Fastifood diet mouse: novel small animal model of NASH with ballooning, progressive fibrosis, and high physiological fidelity to the human condition. Am J Physiol Gastrointest Liver Physiol 301: G825–G834, 2011. doi: 10.1152/ajpgi.00145.2011. [DOI] [PMC free article] [PubMed] [Google Scholar]
- 5.Chen K, Liu ML, Schaffer L, Li M, Boden G, Wu X, Williams KJ. Type 2 diabetes in mice induces hepatic overexpression of sulfatase 2, a novel factor that suppresses uptake of remnant lipoproteins. Hepatology 52: 1957–1967, 2010. doi: 10.1002/hep.23916. [DOI] [PMC free article] [PubMed] [Google Scholar]
- 6.Feaver RE, Cole BK, Lawson MJ, Hoang SA, Marukian S, Blackman BR, Figler RA, Sanyal AJ, Wamhoff BR, Dash A. Development of an in vitro human liver system for interrogating nonalcoholic steatohepatitis. JCI Insight 1: e90954, 2016. doi: 10.1172/jci.insight.90954. [DOI] [PMC free article] [PubMed] [Google Scholar]
- 7.Ha Y, Fang Y, Romecin Duran PA, Tolosa EJ, Moser CD, Fernandez-Zapico ME, Roberts LR. Induction of lysosome-associated protein transmembrane 4 beta via sulfatase 2 enhances autophagic flux in liver cancer cells. Hepatol Commun 3: 1520–1543, 2019. doi: 10.1002/hep4.1429. [DOI] [PMC free article] [PubMed] [Google Scholar]
- 8.Hassing HC, Mooij H, Guo S, Monia BP, Chen K, Kulik W, Dallinga-Thie GM, Nieuwdorp M, Stroes ES, Williams KJ. Inhibition of hepatic sulfatase-2 in vivo: a novel strategy to correct diabetic dyslipidemia. Hepatology 55: 1746–1753, 2012. doi: 10.1002/hep.25580. [DOI] [PMC free article] [PubMed] [Google Scholar]
- 9.Hassing HC, Surendran RP, Derudas B, Verrijken A, Francque SM, Mooij HL, Bernelot Moens SJ, Hart LM, Nijpels G, Dekker JM, Williams KJ, Stroes ES, Van Gaal LF, Staels B, Nieuwdorp M, Dallinga-Thie GM. SULF2 strongly prediposes to fasting and postprandial triglycerides in patients with obesity and type 2 diabetes mellitus. Obesity (Silver Spring) 22: 1309–1316, 2014. doi: 10.1002/oby.20682. [DOI] [PMC free article] [PubMed] [Google Scholar]
- 10.Jiang T, Chen ZH, Chen Z, Tan D. SULF2 promotes tumorigenesis and inhibits apoptosis of cervical cancer cells through the ERK/AKT signaling pathway. Braz J Med Biol Res 53: e8901, 2020. doi: 10.1590/1414-431x20198901. [DOI] [PMC free article] [PubMed] [Google Scholar]
- 11.Kahles F, Findeisen HM, Bruemmer D. Osteopontin: a novel regulator at the cross roads of inflammation, obesity and diabetes. Mol Metab 3: 384–393, 2014. doi: 10.1016/j.molmet.2014.03.004. [DOI] [PMC free article] [PubMed] [Google Scholar]
- 12.Krishnakumar K, Chakravorty I, Foy W, Allen S, Justo T, Mukherjee A, Dhoot GK. Multi-tasking Sulf1/Sulf2 enzymes do not only facilitate extracellular cell signalling but also participate in cell cycle related nuclear events. Exp Cell Res 364: 16–27, 2018. doi: 10.1016/j.yexcr.2018.01.022. [DOI] [PubMed] [Google Scholar]
- 13.Krishnan A, Abdullah TS, Mounajjed T, Hartono S, McConico A, White T, LeBrasseur N, Lanza I, Nair S, Gores G, Charlton M. A longitudinal study of whole body, tissue, and cellular physiology in a mouse model of fibrosing NASH with high fidelity to the human condition. Am J Physiol Gastrointest Liver Physiol 312: G666–G680, 2017. doi: 10.1152/ajpgi.00213.2016. [DOI] [PMC free article] [PubMed] [Google Scholar]
- 14.Lai JP, Sandhu DS, Yu C, Han T, Moser CD, Jackson KK, Guerrero RB, Aderca I, Isomoto H, Garrity-Park MM, Zou H, Shire AM, Nagorney DM, Sanderson SO, Adjei AA, Lee JS, Thorgeirsson SS, Roberts LR. Sulfatase 2 up-regulates glypican 3, promotes fibroblast growth factor signaling, and decreases survival in hepatocellular carcinoma. Hepatology 47: 1211–1222, 2008. doi: 10.1002/hep.22202. [DOI] [PMC free article] [PubMed] [Google Scholar]
- 15.Lai JP, Thompson JR, Sandhu DS, Roberts LR. Heparin-degrading sulfatases in hepatocellular carcinoma: roles in pathogenesis and therapy targets. Future Oncol 4: 803–814, 2008. doi: 10.2217/14796694.4.6.803. [DOI] [PMC free article] [PubMed] [Google Scholar]
- 16.Lamanna WC, Baldwin RJ, Padva M, Kalus I, Ten Dam G, van Kuppevelt TH, Gallagher JT, von Figura K, Dierks T, Merry CL. Heparan sulfate 6-O-endosulfatases: discrete in vivo activities and functional co-operativity. Biochem J 400: 63–73, 2006. doi: 10.1042/BJ20060848. [DOI] [PMC free article] [PubMed] [Google Scholar]
- 17.Lancha A, Rodríguez A, Catalán V, Becerril S, Sáinz N, Ramírez B, Burrell MA, Salvador J, Frühbeck G, Gómez-Ambrosi J. Osteopontin deletion prevents the development of obesity and hepatic steatosis via impaired adipose tissue matrix remodeling and reduced inflammation and fibrosis in adipose tissue and liver in mice. PLoS One 9: e98398, 2014. doi: 10.1371/journal.pone.0098398. [DOI] [PMC free article] [PubMed] [Google Scholar]
- 18.Listenberger LL, Studer AM, Brown DA, Wolins NE. Fluorescent detection of lipid droplets and associated proteins. Curr Protoc Cell Biol 71: 4.3.1–4.3.14, 2016. doi: 10.1002/cpcb.7. [DOI] [PubMed] [Google Scholar]
- 19.Mahley RW, Ji ZS. Remnant lipoprotein metabolism: key pathways involving cell-surface heparan sulfate proteoglycans and apolipoprotein E. J Lipid Res 40: 1–16, 1999. [PubMed] [Google Scholar]
- 20.Mas E, Danjoux M, Garcia V, Carpentier S, Ségui B, Levade T. IL-6 deficiency attenuates murine diet-induced non-alcoholic steatohepatitis. PLoS One 4: e7929, 2009. doi: 10.1371/journal.pone.0007929. [DOI] [PMC free article] [PubMed] [Google Scholar]
- 21.Matikainen N, Burza MA, Romeo S, Hakkarainen A, Adiels M, Folkersen L, Eriksson P, Lundbom N, Ehrenborg E, Orho-Melander M, Taskinen MR, Borén J. Genetic variation in SULF2 is associated with postprandial clearance of triglyceride-rich remnant particles and triglyceride levels in healthy subjects. PLoS One 8: e79473, 2013. doi: 10.1371/journal.pone.0079473. [DOI] [PMC free article] [PubMed] [Google Scholar]
- 22.Matsuo I, Kimura-Yoshida C. Extracellular distribution of diffusible growth factors controlled by heparan sulfate proteoglycans during mammalian embryogenesis. Philos Trans R Soc Lond B Biol Sci 369: 20130545, 2014. doi: 10.1098/rstb.2013.0545. [DOI] [PMC free article] [PubMed] [Google Scholar]
- 23.Nakamura I, Fernandez-Barrena MG, Ortiz-Ruiz MC, Almada LL, Hu C, Elsawa SF, Mills LD, Romecin PA, Gulaid KH, Moser CD, Han JJ, Vrabel A, Hanse EA, Akogyeram NA, Albrecht JH, Monga SP, Sanderson SO, Prieto J, Roberts LR, Fernandez-Zapico ME. Activation of the transcription factor GLI1 by WNT signaling underlies the role of SULFATASE 2 as a regulator of tissue regeneration. J Biol Chem 288: 21389–21398, 2013. doi: 10.1074/jbc.M112.443440. [DOI] [PMC free article] [PubMed] [Google Scholar]
- 24.Oniciu DC, Hashiguchi T, Shibazaki Y, Bisgaier CL. Gemcabene downregulates inflammatory, lipid-altering and cell-signaling genes in the STAM model of NASH. PLoS One 13: e0194568, 2018. doi: 10.1371/journal.pone.0194568. [DOI] [PMC free article] [PubMed] [Google Scholar]
- 25.Oseini AM, Cole BK, Issa D, Feaver RE, Sanyal AJ. Translating scientific discovery: the need for preclinical models of nonalcoholic steatohepatitis. Hepatol Int 12: 6–16, 2018. doi: 10.1007/s12072-017-9838-6. [DOI] [PMC free article] [PubMed] [Google Scholar]
- 26.Setiawan VW, Stram DO, Porcel J, Lu SC, Le Marchand L, Noureddin M. Prevalence of chronic liver disease and cirrhosis by underlying cause in understudied ethnic groups: The multiethnic cohort. Hepatology 64: 1969–1977, 2016. doi: 10.1002/hep.28677. [DOI] [PMC free article] [PubMed] [Google Scholar]
- 27.Stanford KI, Bishop JR, Foley EM, Gonzales JC, Niesman IR, Witztum JL, Esko JD. Syndecan-1 is the primary heparan sulfate proteoglycan mediating hepatic clearance of triglyceride-rich lipoproteins in mice. J Clin Invest 119: 3236–3245, 2009. doi: 10.1172/JCI38251. [DOI] [PMC free article] [PubMed] [Google Scholar]
- 28.Vernon G, Baranova A, Younossi ZM. Systematic review: the epidemiology and natural history of non-alcoholic fatty liver disease and non-alcoholic steatohepatitis in adults. Aliment Pharmacol Ther 34: 274–285, 2011. doi: 10.1111/j.1365-2036.2011.04724.x. [DOI] [PubMed] [Google Scholar]
- 29.Wieckowska A, Papouchado BG, Li Z, Lopez R, Zein NN, Feldstein AE. Increased hepatic and circulating interleukin-6 levels in human nonalcoholic steatohepatitis. Am J Gastroenterol 103: 1372–1379, 2008. doi: 10.1111/j.1572-0241.2007.01774.x. [DOI] [PubMed] [Google Scholar]
- 30.Wu X, Chen K, Williams KJ. The role of pathway-selective insulin resistance and responsiveness in diabetic dyslipoproteinemia. Curr Opin Lipidol 23: 334–344, 2012. doi: 10.1097/MOL.0b013e3283544424. [DOI] [PubMed] [Google Scholar]
- 31.Yamaguchi K, Itoh Y, Yokomizo C, Nishimura T, Niimi T, Umemura A, Fujii H, Okanoue T, Yoshikawa T. Blockade of IL-6 signaling exacerbates liver injury and suppresses antiapoptotic gene expression in methionine choline-deficient diet-fed db/db mice. Lab Invest 91: 609–618, 2011. doi: 10.1038/labinvest.2011.2. [DOI] [PubMed] [Google Scholar]
- 32.Younossi ZM, Koenig AB, Abdelatif D, Fazel Y, Henry L, Wymer M. Global epidemiology of nonalcoholic fatty liver disease-meta-analytic assessment of prevalence, incidence, and outcomes. Hepatology 64: 73–84, 2016. doi: 10.1002/hep.28431. [DOI] [PubMed] [Google Scholar]


