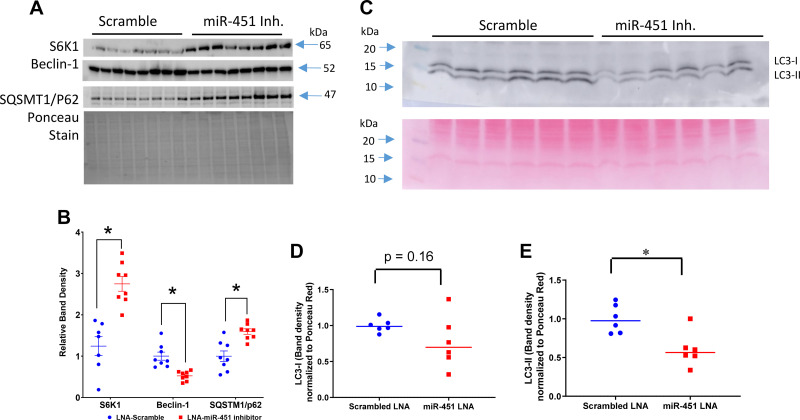
Fig. 6.
Assessment of cortex autophagy process in TallyHo/Jng (TH) mice. A and B: Western blot analysis (A) and relative band density summaries (B; normalized to Ponceau stain) for p70 S6 kinase 1 (S6K1), beclin-1, and sequestosome 1 (SQSTM1/p62). C–E: representative Western blot analysis (C) and density summaries for microtubule-associated protein 1A/1B light chain 3B (LC3)-I (D) and LC3-II (E). LNA, locked nucleic acid. Data are presented as means ± SE; n = 6–8 mice/group. *An unpaired t test was used to determine significance, with P < 0.05 considered significant.

