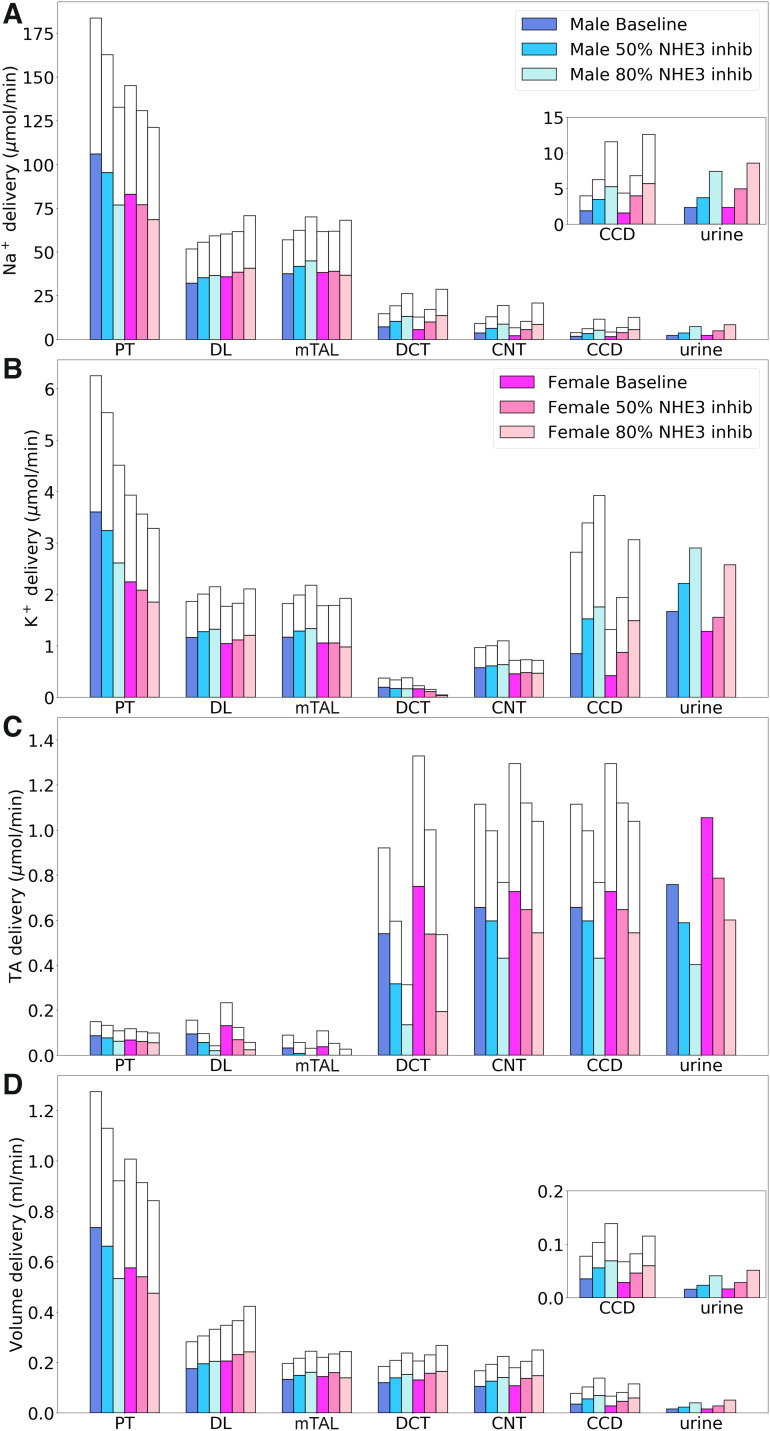
Fig. 6.
Comparison of solute delivery (A–C) and fluid delivery (D) obtained for the base case and for 50% and 80% inhibition of Na+/H+ exchanger 3 (NHE3). Colored bars show superficial nephron values; white bars show juxtamedullary values. Delivery values are computed per kidney. Insets: reproductions of distal segment values. PT, proximal tubule; DL, descending limb; mTAL, medullary thick ascending limb; DCT, distal convoluted tubule; CNT, connecting tubule; CCD, cortical collecting duct; TA, titratable acid.

