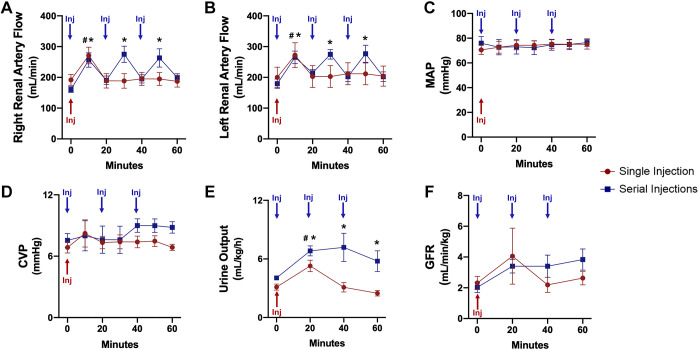
Fig. 3.
Renal function during intra-arterial injection of autologous mitochondria in the nonischemic kidney. A: right renal artery flow. B: left renal artery flow. C: mean arterial pressure (MAP). D: central vein pressure (CVP). E: urine output. F: glomerular filtration rate (GFR). All results are means ± SE for each group. Blue arrows show the time of injection of mitochondria in the serial injection group; the red arrow represents the time of injection of mitochondria in the single injection group. In A–D, data are shown for the time of injection and 1 min after each injection or the 20-min interval. Data were analyzed by two-way repeated-measures ANOVA with the Benjamini and Hochberg's false discovery rate (n = 10 in both groups). *P < 0.05, designated time point vs. baseline for serial injections; #P < 0.05, designated time point vs. baseline for single injection.

