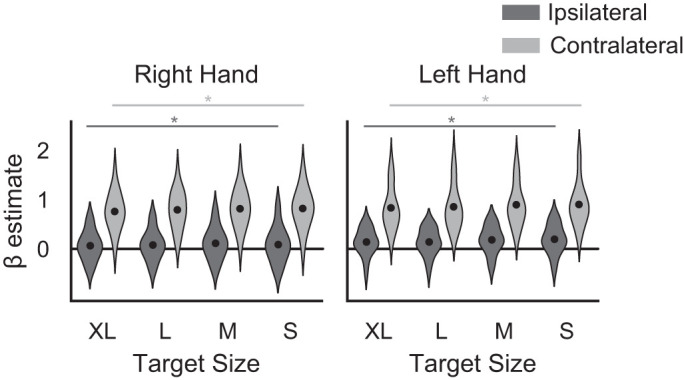
Fig. 4.

Violin plot of the overall β estimates of blood oxygen level-dependent (BOLD) activation levels in individually defined primary motor cortex (M1) regions of interest (ROIs) for right and left hands. Black dots show the mean estimate. *Significant main effect of target size for the given M1 ROI and hand used.
