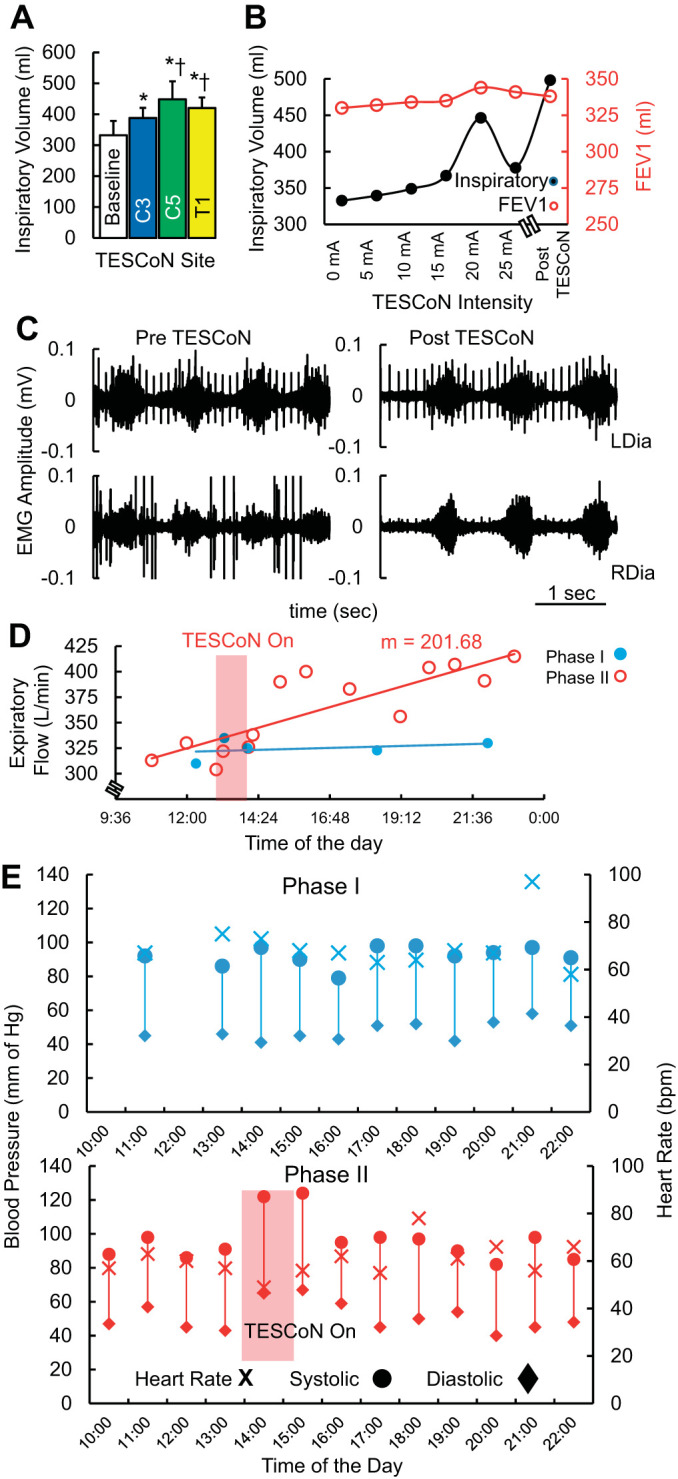
Fig. 2.

Acute effect of transcutaneous electrical spinal cord neuromodulation (TESCoN) on respiratory and cardiovascular function at the start of phase II (day 0). A: average inspiratory volume (n = 5 cycles) without stimulation (baseline) and with TESCoN at 20 mA at C3–4, C5–6, and T1–2 vertebral levels. B: inspiratory and expiratory volume (FEV1) when stimulated at intensities from 0 mA to 25 mA at C5 and (~75 min) after the first stimulation (Post TESCoN). C: diaphragm electromyography (EMG) during normal breathing before and after 75 min of assessment on the first day of phase II (day 0). D: peak expiration flow over the course of 15 h within a single day during phase I (day −1 in blue) and during phase II (day 1 in red). The 1-h TESCoN therapy occurred during the time window marked by the red box. m, Slope of the linear regression. E: blood pressure and heart rate over the course of 15 hours within a single day during phase I (day −1 in blue) and during phase II (day 1 in red). The 1-h TESCoN therapy occurred during the time window marked by the red box. bpm, beats/min; LDia, left diaphragm; RDia, right diaphragm.
