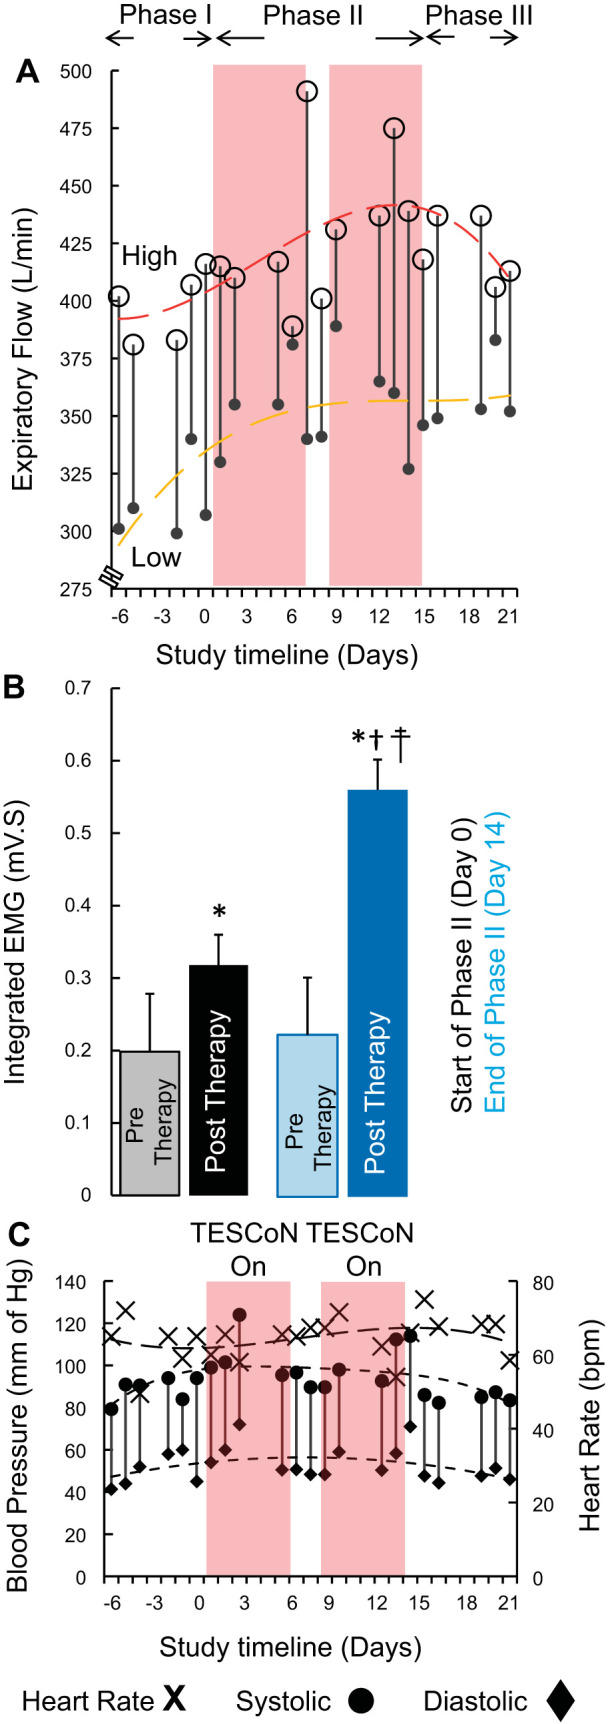
Fig. 3.

A: highest (open circles) and lowest (solid circle) peak expiratory flow (n = 3 cycles from hourly recordings between 10:00 AM and 10:00 PM) each day during phases I, II, and III. The red and yellow trendlines fit the highest and lowest measures for each day. B: mean (±SD) integrated electromyogram (EMG) during inspiration immediately before the start of phase II (day 0) and immediately after the end of phase II (day 14). Pretherapy recordings were made before initiation of transcutaneous electrical spinal cord neuromodulation (TESCoN). Posttherapy recordings were made after 60 min of TESCoN therapy. C: blood pressure (vertical lines) representing systolic (circle) and diastolic (diamond) data and heart rate (×) recorded during phases I, II, and III. *P < 0.05, statistically different from pretherapy (day 0). †P < 0.05, statistically different from pretherapy (day 14). ‡P < 0.05, statistically different from posttherapy (day 0). Mann–Whitney U test was used to compare mean data (n = 5 cycles) between pretherapy and posttherapy and between day 0 and day 14.
