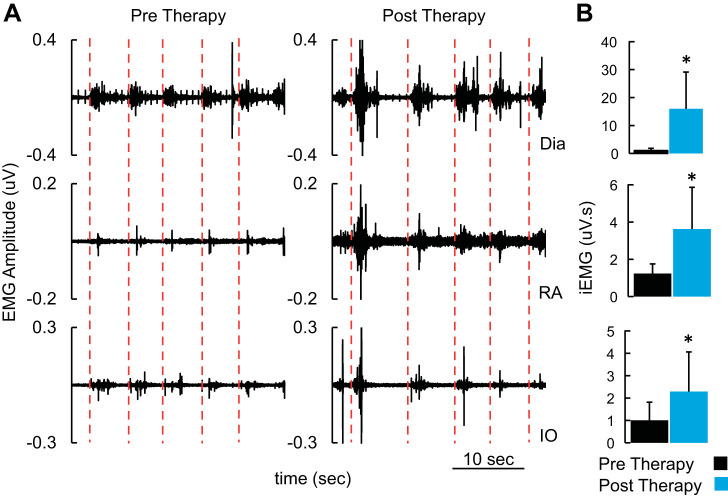
Fig. 4.
A: electromyogram (EMG) recorded from diaphragm and pelvic floor muscles during voluntary coughing. Note the red lines mark the initiation of the voluntary cough. B: mean (+SD) integrated EMG (iEMG) for each cough cycle shown in A. *P < 0.05, statistically different from pretherapy. Mann–Whitney U test was used to compare mean data (n = 5 cycles) between pretherapy and posttherapy. Dia, diaphragm; IO, internal oblique; RA, rectus abdominus.

