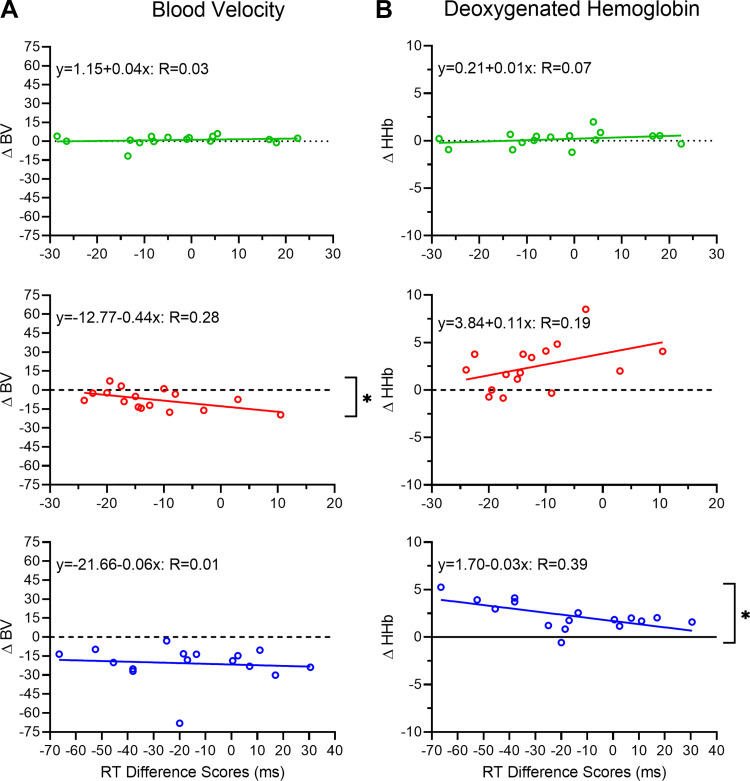
Fig. 4.
A and B: participant-specific blood velocity (BV) and deoxygenated hemoglobin (HHb) difference scores (i.e., baseline minus steady state), respectively, correlated with their respective reaction time (RT) difference scores (i.e., post- minus precondition oculomotor assessment) as a function of control (top), exercise (middle), and hypercapnia (bottom) conditions. Linear regression lines and associated regression equations (and proportion of explained variance) are presented. *P < 0.05, significant correlations.

