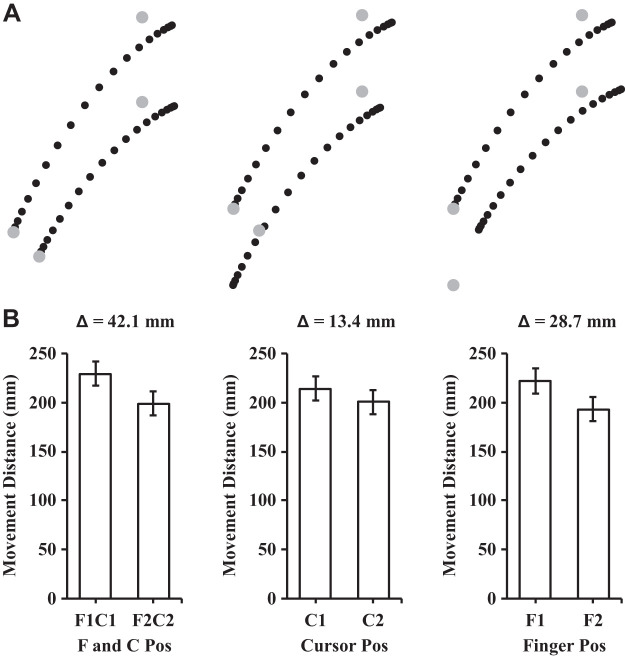
Fig. 5.
A: mean trajectories for the postexercise aiming conditions. Left: aligned conditions (i.e., F1C1 and F2C2); middle: different cursor positions with the same finger position (i.e., F1C1 and F1C2); right: different finger positions with the same cursor position (i.e., F1C1 and F2C1). Each dot represents the position at every 5% of the movement time. B: mean movement distances in the different finger and cursor positions. The Δ value describes the difference in mean movement distance between the conditions in the associated bar graphs. Error bars depict means ± SE.

