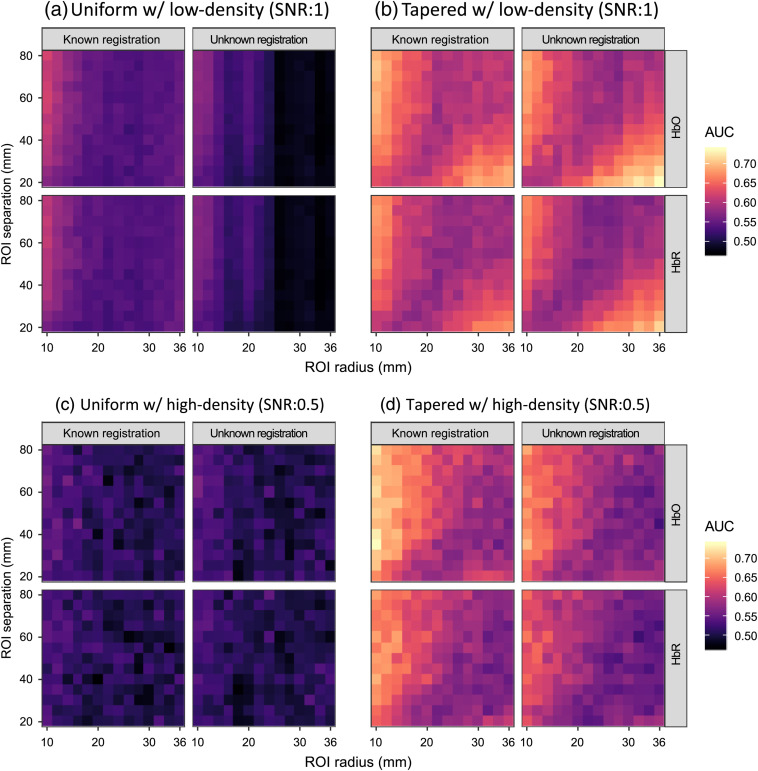
Fig. 10.
The heatmap showing the AUCs of recognizing the hemoglobin activity difference between two ROIs for simulation data under the conditions where the probe registration information is known or not. The color of each small rectangle in the lattices, whose scale is indicated by the legend, represents the AUC calculated from 2000 simulation iterations using its abscissa and ordinate as the ROI radius and separation, respectively. Two types of probes, (a), (b) low-density and (c), (d) high-density, are used in the simulations, and the results using (a), (c) uniform contrast vector and (b), (d) tapered contrast vector, respectively. Within each panel, the column and row of each subplot indicate known/unknown probe registration and oxy-/deoxyhemoglobin, respectively.

