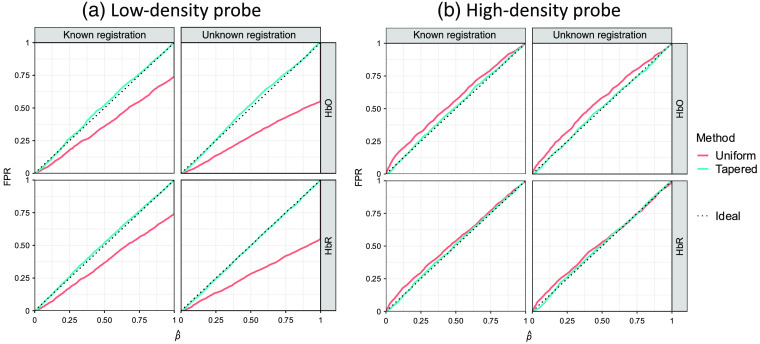
Fig. 11.
Each subplot shows the empirical FPR versus reported -value curves of recognizing the hemoglobin activity difference between two ROIs using the two types of contrast vectors (indicated by color) for simulation data analyses under the conditions where the probe registration information is known or not. The simulated activities are generated within one of the two 10-mm (radius) ROIs separated by 80 mm, and two types of probe, (a) low-density and (b) high-density, are used in the simulation. The column and row of each subplot indicate known/unknown probe registration and oxy-/deoxyemoglobin, respectively. For a single curve, the abscissa of each data point is the FPR using its ordinate as the threshold. In an ideal situation, the empirical FPR equals the model-reported -value, which is represented by the dotted diagonal of each plot.

