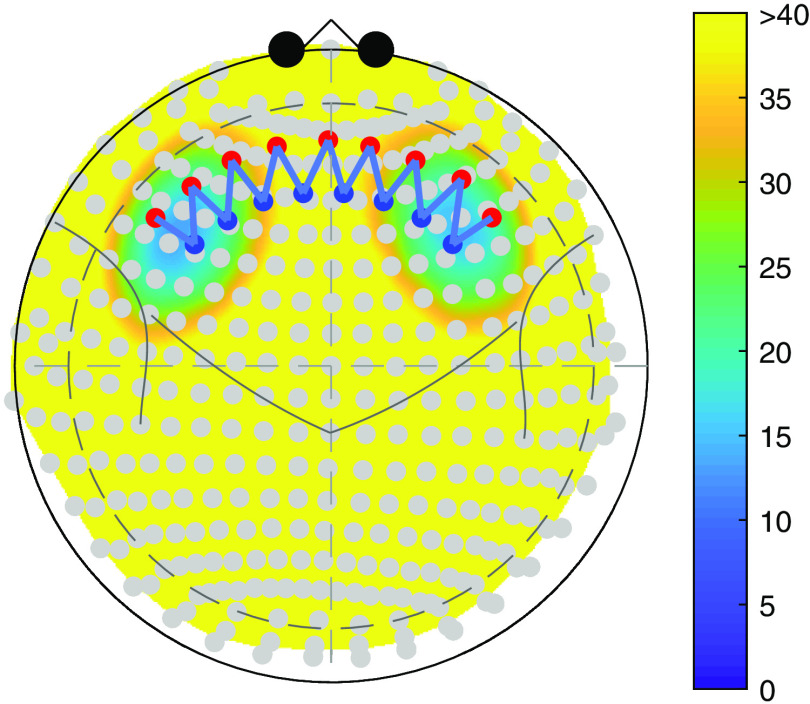
Fig. 5.
An example of ROI selection. The color map represents the depth from each node in the ROI to the head surface. The yellow area indicates a depth greater than 40 mm, which is unreachable by the light. The stimulation is generated within the ROI in the left hemisphere while the right one is used as the null region.

