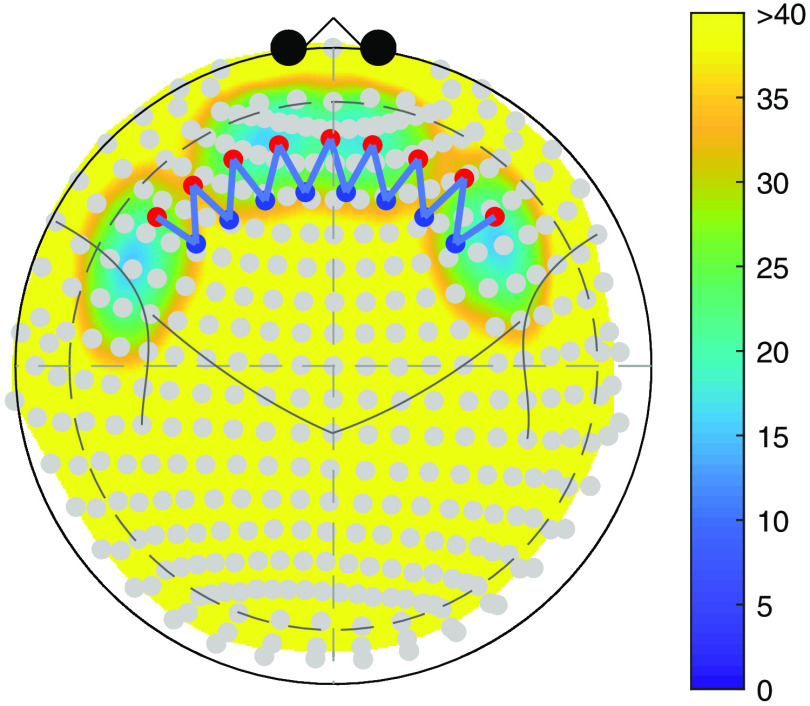
Fig. 6.
An example of ROI selection for region difference analysis. The legend is same as that in Fig. 5. Note that it looks like the ROIs in the left and right hemispheres overlap each other, but they do not actually because of the existence of a cerebral fissure.

