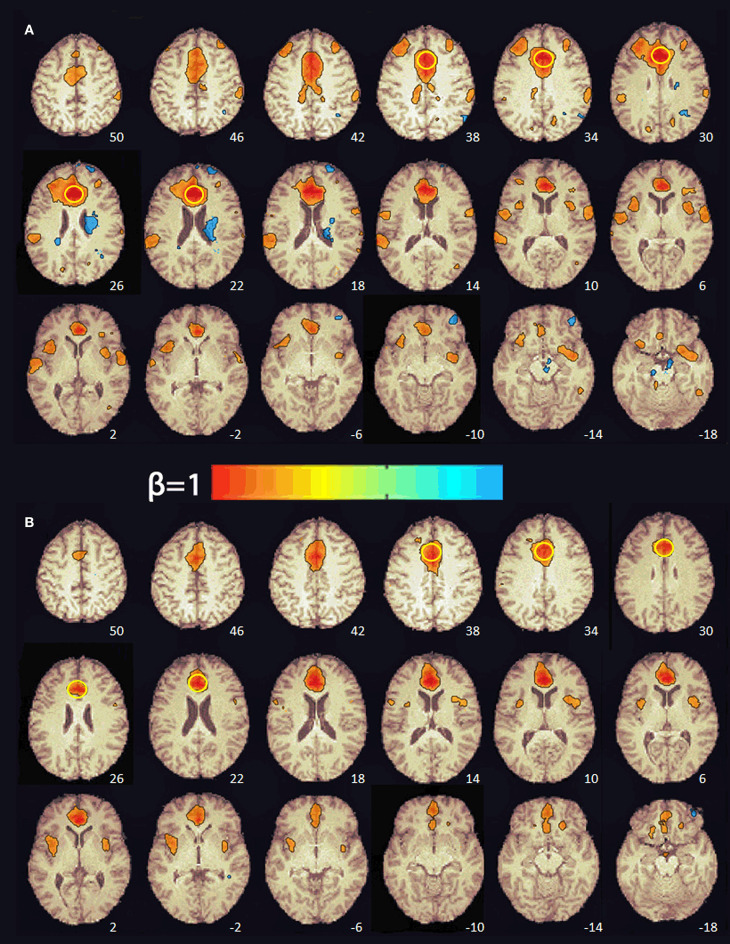
Figure 2.
Functional connectivity maps from the pre-treatment (A) and post-treatment (B) scans showing regions functionally connected to the seed in the anterior cingulate cortex. The numbers at the bottom right indicate the z coordinate (mm). The yellow circle denotes the seed in the anterior cingulate cortex. The color bar indicates the beta weight of the functional connections. The maps were thresholded at β ≥ 0.4.

