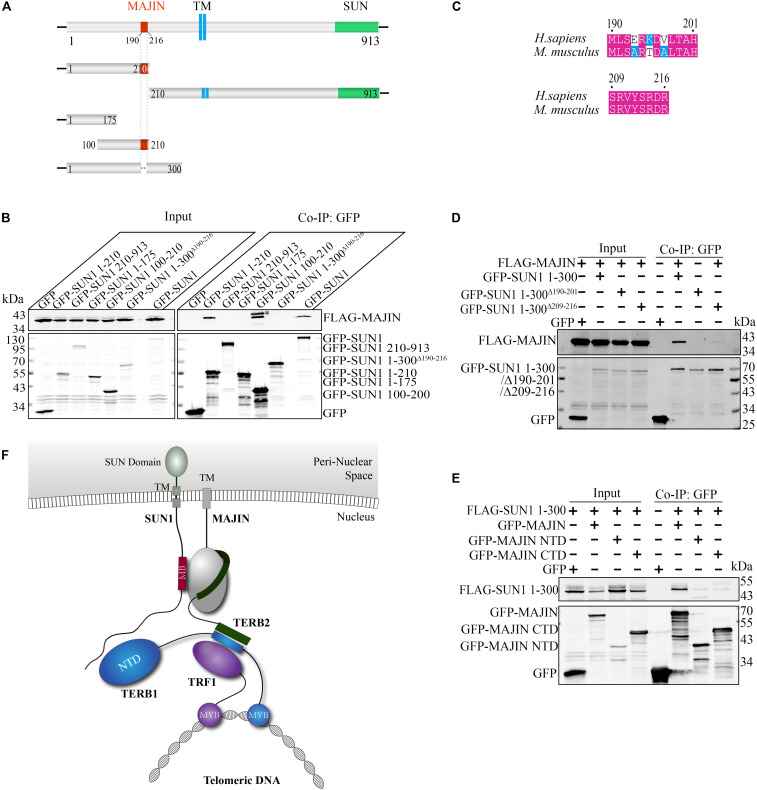
FIGURE 2.
Binding sites between SUN1 and MAJIN. (A) Illustration of the MAJIN-binding site at SUN1. The MAJIN-binding site is shown in red, the trans-membrane region is blue, and the SUN domain is green. TM: trans-membrane region. (B) The 190–216 Aa of SUN1 is the binding site of MAJIN. ∗Indicating the band of GFP-SUN1 100–210 Aa. (C) Illustration of the two conserved sequences of SUN1 in the MAJIN binding site. (D) The SUN1-MAJIN interaction is affected by deletion of 190–201 and 209–216 Aa. (E) Both the NTD and CTD of MAJIN interact with SUN1. (F) Illustration of the interaction of SUN1 with MAJIN. The MAJIN-binding site is shown in red and named “MB.”

