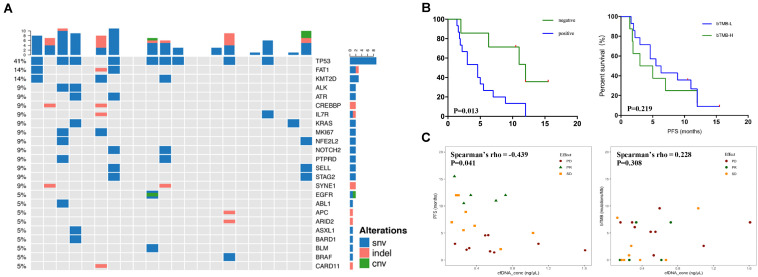
FIGURE 1.
The relationship between blood mutational landscape and therapeutic response. (A) The pre-therapeutic blood ctDNA mutational landscape. (B) Keplan–Meier survival analysis of patients with negative or positive ctDNA mutation detection (left panel, 7 patients with negative and 15 patients with positive ctDNA mutation detection) or patients with low or high bTMB levels (right panel, 8 patients with high and 14 patients with low bTMB levels). (C) Correlation between cfDNA concentration and PFS (left panel) or bTMB (right panel).

