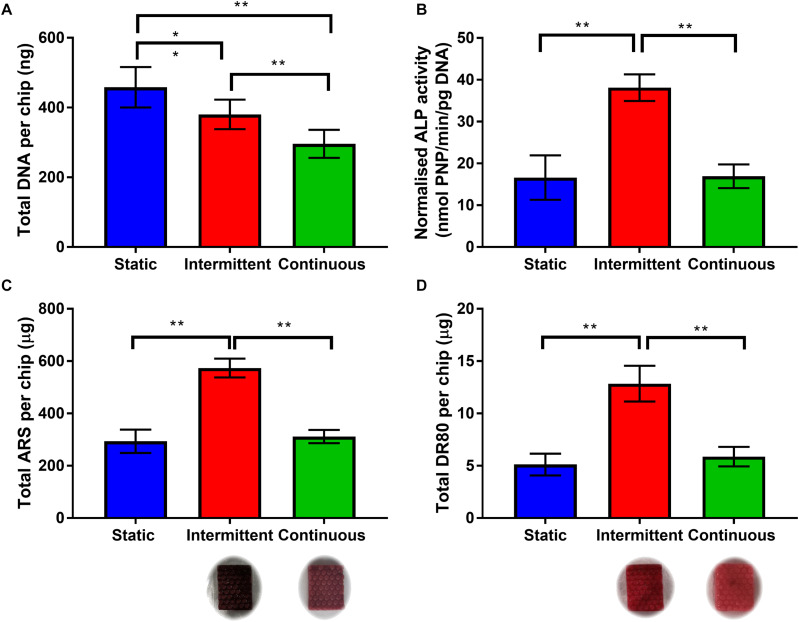
FIGURE 4.
(A) Total DNA per chip for each flow profile on day 14. Both intermittent and continuous are significantly lower than static, with continuous significantly lower than intermittent (n = 8) (∗p < 0.05, ∗∗p < 0.01). (B) Day 14 ALP activity normalized to total DNA. The intermittent flow profile resulted in significantly higher normalized activity than the static control and continuous flow profile. There is no significant different between static and continuous. (C,D) Comparison of matrix deposition of hES-MPs in three different flow conditions at day 21 in OIM. (C) Total Alizarin Red S (ARS) staining per chip, calcium content is significantly higher for intermittent flow, there is no difference between static and continuous. (D) Total Direct Red 80 (DR80) staining per chip, collagen deposition is also significantly higher for intermittent flow, no difference between static and continuous. Representative images inserted below the intermittent and continuous flow conditions (n = 8) (**p < 0.01).

