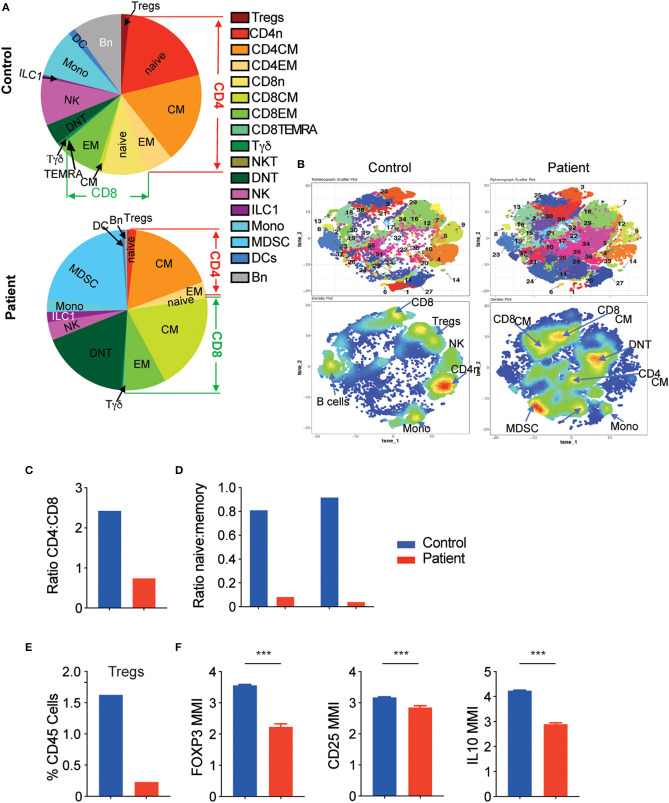
Figure 3.
The LRBA-deficient patient exhibits significantly altered immune landscape. (A) Main immune subtypes as a proportion of total leukocytes in control and patient samples. (B) tSNE map generated after Phenograph clustering of all samples combined. Top row: cluster map. Bottom row: density plots. (C) Ratio of CD4+ to CD8+ T cells and (D) ratio of naïve:memory T cells in control and patient samples. (E) Tregs as percent of total leukocytes. (F) Mean metal intensity (MMI) of FOXP3, CD25, and IL-10 in patient and control Tregs. ***P < 0.001. CM, central memory; DC, dendritic cells; DNT, double negative T cells; EM, effector memory; ILC, innate lymphoid cells; MDCS, myeloid derived suppressor cells; Mono, monocytes; n, naïve; NKT, natural killer T cells; Tregs, regulatory T cells.

