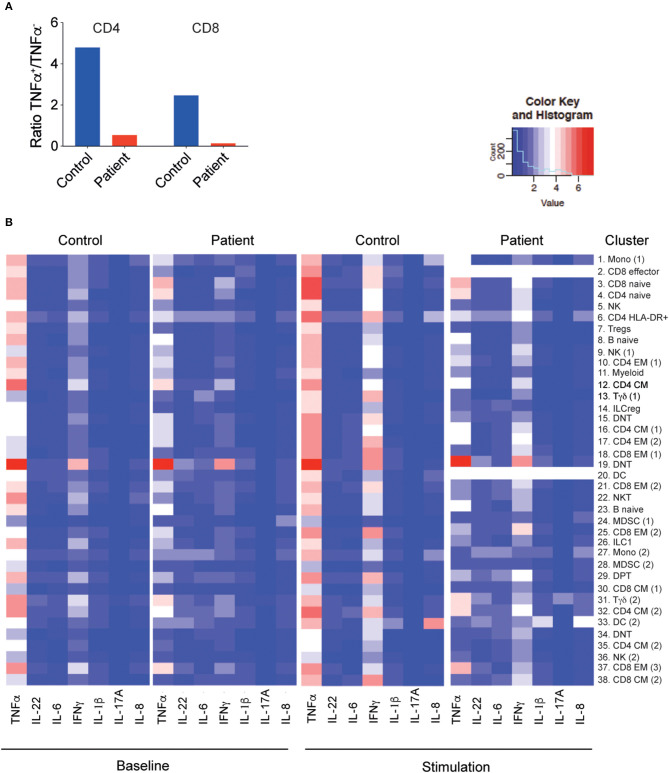
Figure 5.
Decreased cytokine production by the LRBA-deficient patient. (A) Ratio of memory T cells producing TNF-α to those not producing any TNF-α, without stimulation. (B) Heatmap of cytokine expression under baseline conditions and with PMA/I stimulation in clusters associated with Figure 3B. PMA/I, phorbol 12-myristate 13-acetate and ionomycin.

