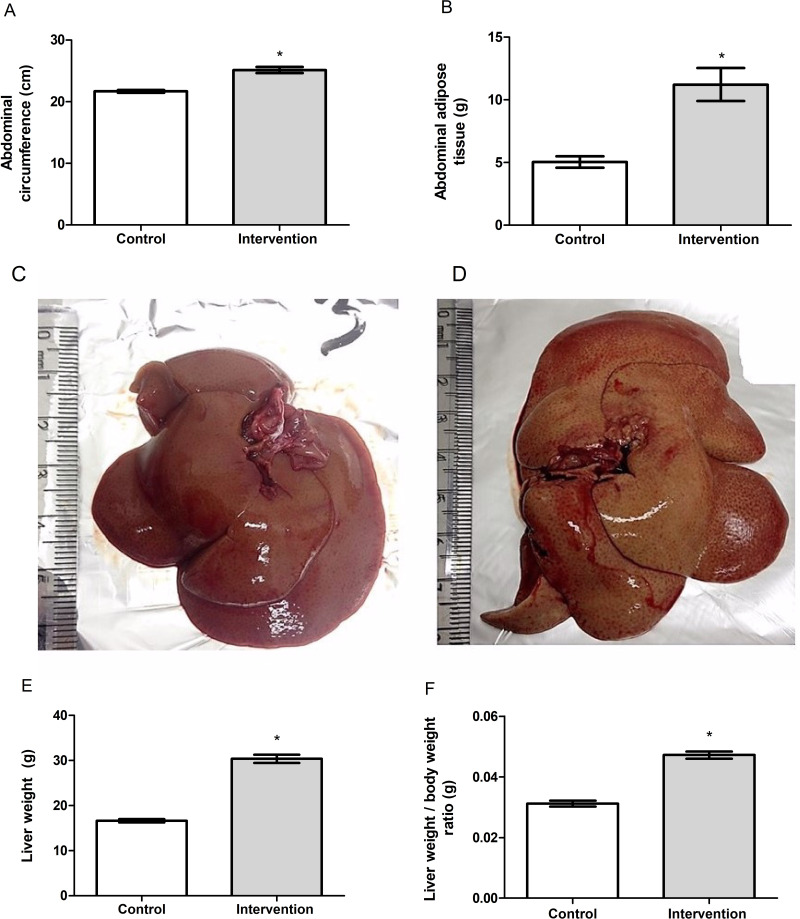
Figure 2.
(A) Abdominal circumference, (B) abdominal adipose tissue, (C) macroscopic appearance of liver in the control group, (D) macroscopic appearance of liver in the intervention group, (E) liver weight and (F) liver weight/body weight ratio of the animal. *Significant effect of the high-fat and choline-deficient diet (p < 0.001). Data expressed as mean ± standard deviation, Student’s t-test. Each experimental group with 10 male Sprague Dawley rats.

