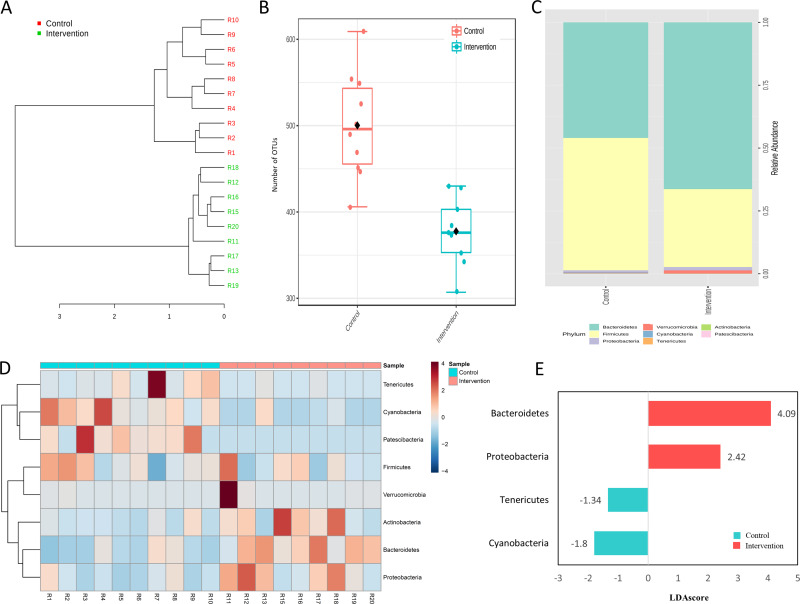
Figure 5.
Gut microbiota features in control and intervention. (A) Hierarchical clustering dendrogram based on the Bray-Curtis dissimilarity index, (B) Number of OTUs, (C) Relative abundance, (D) distribution of the eight observed phyla and (E) Histogram of the LDA scores (log10) computed for the four differentially abundant phyla. Each experimental group with 10 male Sprague Dawley rats.

