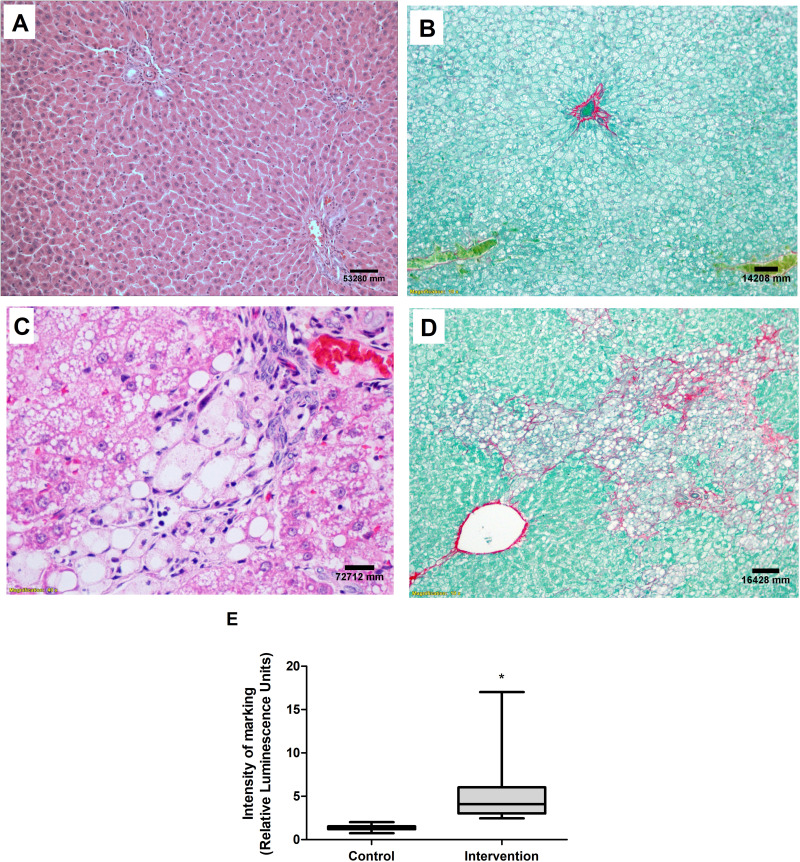
Figure 6.
Liver histological evaluation. Images referring to the control (A) and intervention (C) groups, H&E staining and both at 40X magnification. Picrosirius staining in the control (B) and intervention (D) groups, both at 10X magnification. (E) Quantification of collagen fibers. *Significant effect of the high-fat and choline-deficient (p < 0.001). Data expressed as median (25th-75th percentile), Mann–Whitney U-test. Each experimental group with 10 male Sprague Dawley rats.

