FIGURE 7.
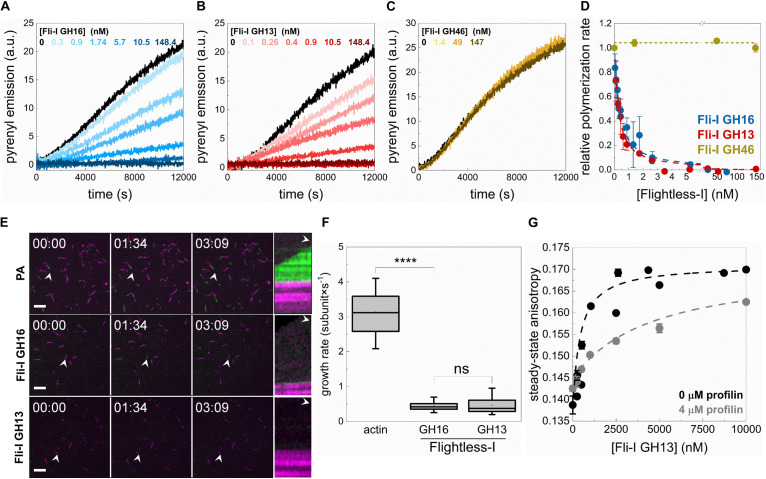
Profilin supports barbed end capping but interferes with the monomer binding activity of Flightless-I. (A–C) Polymerization kinetics of profilin:G-actin (PA) followed by the change in pyrenyl emission in the absence or presence of different concentrations of GST-Fli-I. Conditions: [actin] = 2.5 μM (2% pyrenyl labeled), [profilin] = 6 μM. (D) Relative polymerization rate as a function of [GST-Fli-I]. Data are shown as mean ± SD, n = 2–7. Blue and red dashed lines show the fit to the data (Eq. 1). The fit gave IC50(Fli–I GST–GH16) = 0.93 ± 0.12 nM and IC50(Fli–I GST–GH13) = 0.13 ± 0.01 nM. (E) Representative montages of profilin:actin (PA) assembly (green) from preformed F-actin seeds (magenta) followed by TIRFM in the absence or presence of GST-Fli-I. Arrowheads highlight the filaments that were tracked for kymographs. Conditions: [actin] = 0.5 μM (10% Alexa488NHS or Alexa568NHS labeled), [profilin] = 2 μM, [GST-Fli-I] = 10 nM. Scale bar = 10 μm, time = min:s. (F) Filament growth rate from profilin:actin in the absence or presence of GST-Fli-I derived from time-lapse TIRFM images shown on (E), n = 37–62. (G) Steady-state anisotropy of Alexa488NHS-G-actin (0.2 μM) in complex with profilin (4 μM) as a function of [GST-Fli-I]. Data are shown as mean ± SD, n = 2–3. Dashed lines in the corresponding color show the fit of the data according to Eq. 3. The fit gave dissociation equilibrium constants of KD(Fli–I GST–GH13) = 411.43 ± 22.69 nM (in the absence of profilin) and KD(Fli–I GST–GH13) = 4511.6 ± 631.92 nM (in the presence of profilin). ****p < 0.0001.

