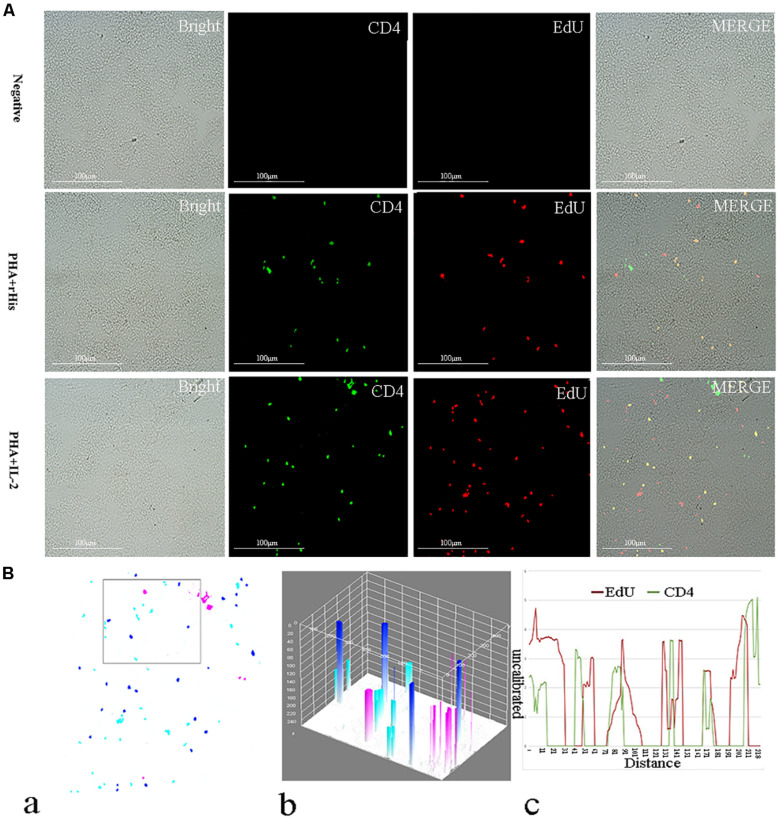
FIGURE 6.
Co-localization analysis of EdU and CD4 in the spleen of flounder. (A) Indirect immunofluorescence of EdU and CD4 in flounder spleen after PHA + rHis, PHA + rHis-IL-2 injection on day 7; bar = 100μm. The unimmunized serum was used as primary antibody for negative control. (B) Image analysis for co-localization of EdU and CD4 in a selected area of spleen using Image J software. (a) A new merged image showing the PHA + rHis-IL-2 group in Figure 4A. Compared with the above image, magenta was represented CD4-positive signals, aqua was represented EdU-positive signals, blue was represented EdU and CD4 double-positive signals, respectively. (b) The interactive 3D surface plot of the selected area (the position of the rectangle) of (a). (c) Analysis of co-localization of EdU and CD4 according to the optical density of three fluorescence in the selected area (the position of the rectangle of a). 15 fish per group.

