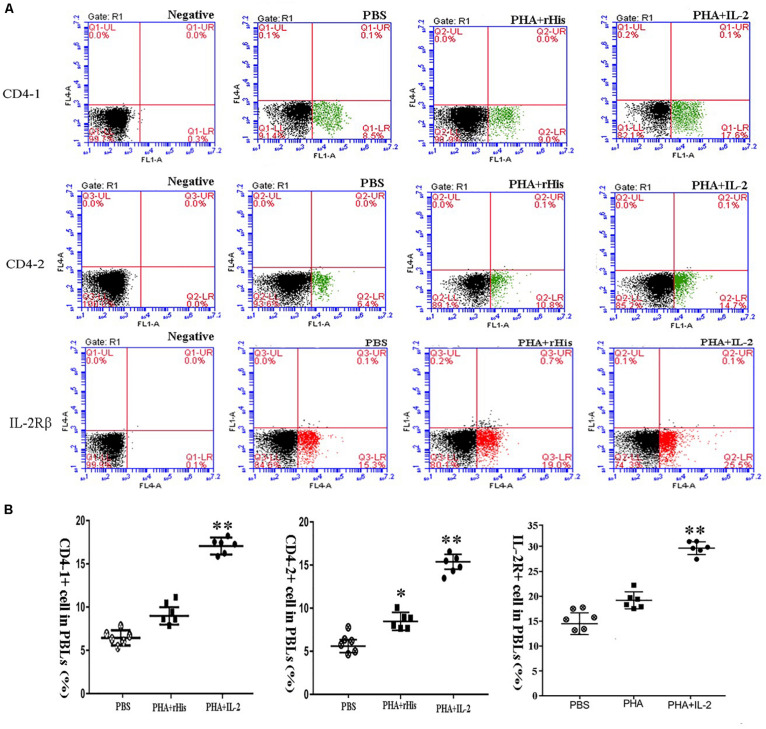
FIGURE 8.
FCM assay investigating the proportion of CD4-1+ T lymphocytes, CD4-2+ T lymphocytes, and IL-2Rβ+ cells in peripheral blood of flounder cultured in vitro after rIL-2 addition at 72 h. (A) The representative dots of the results for CD4-1+ T lymphocytes, CD4-2+ T lymphocytes, and IL-2Rβ+ ells from PBS, PHA + rHis, and PHA + rHis-IL-2 groups at 72 h post addition. FCM was used to analyze the stained cells. (B) Percentages of CD4-1+ T lymphocytes, CD4-2+ T lymphocytes, and IL-2Rβ+ cells in different groups. All values are expressed as mean ± SD from the six of independent experiments. Asterisks (*) above the bar represent the statistical significant difference, *p < 0.05, **p < 0.01.

