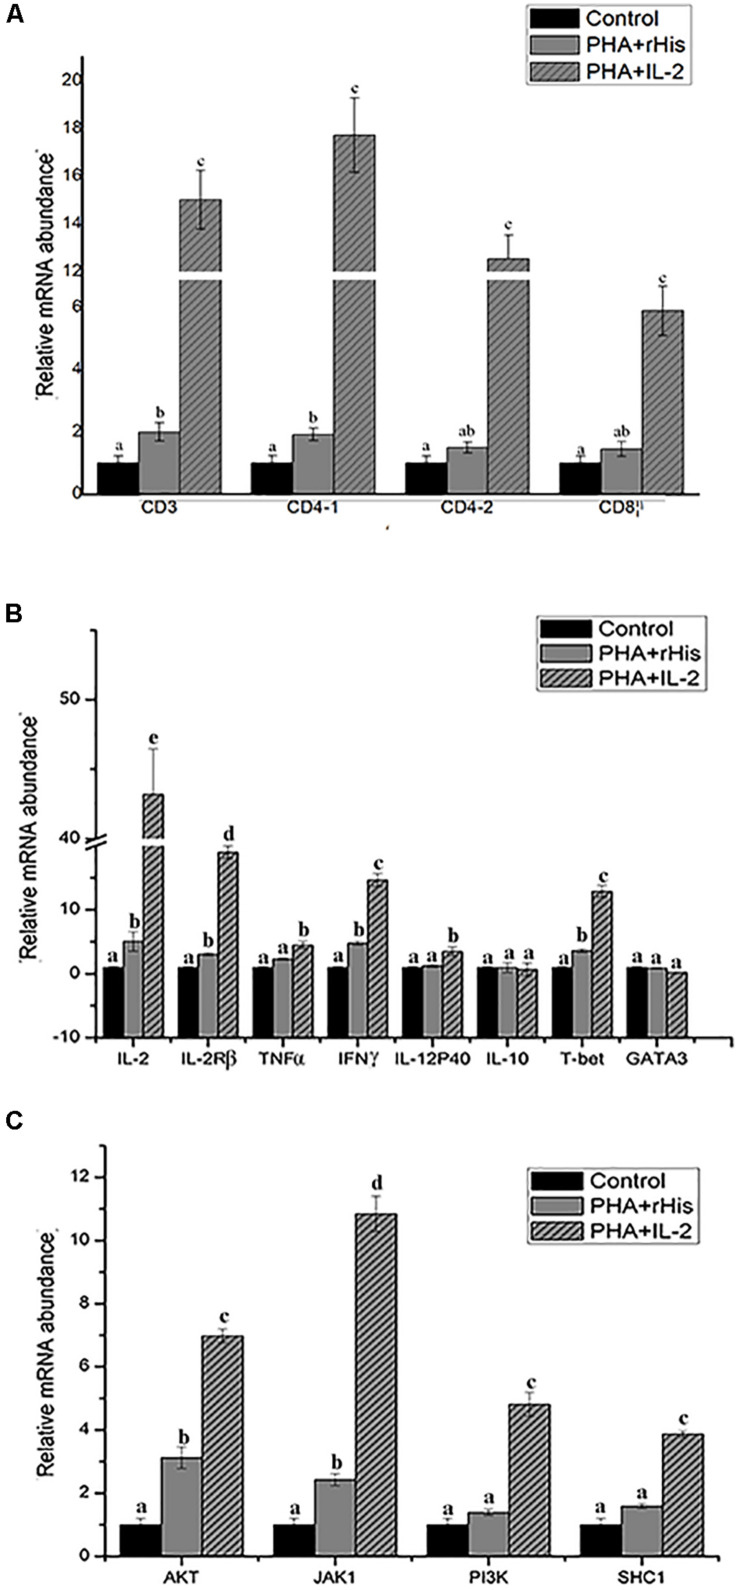
FIGURE 9.
Relative gene expression in PBLs of flounder after addition of PBS, PHA + rHis, and PHA + rHis-IL-2 at 72 h. (A) The gene expression profile of T cell markers (CD3, CD4-1, CD4-2, and CD8β). (B) The gene expression profile of related cytokines (IL-2, IL-2Rβ, TNFα, IFNγ, IL-12p40, and IL-10), transcription factors (T-bet and GATA3). (C) The gene expression profile of IL-2 pathway (AKT, JAK1, PI3K, SHC1). The results represent the mean ± SD from the three independent experiments. Different letters above the bar represent the statistical significance (p < 0.05).

