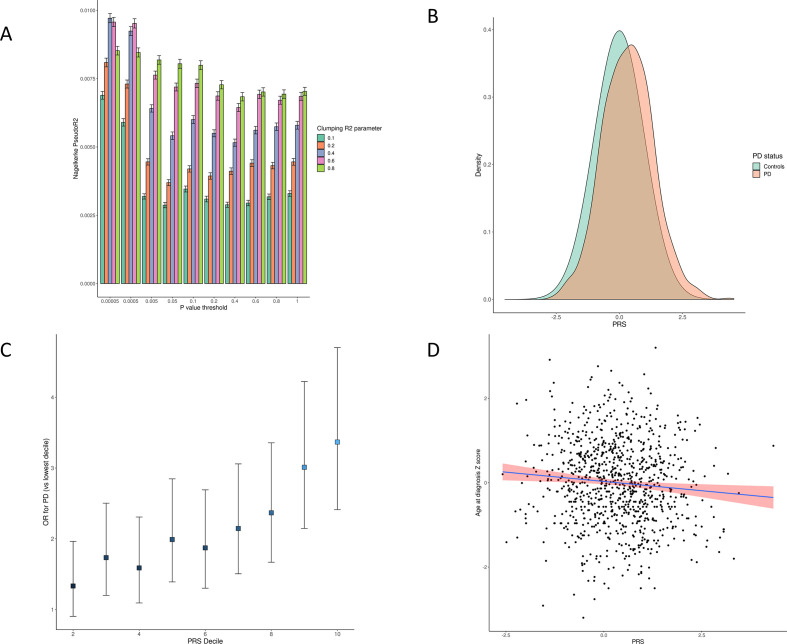
Figure 3.
(A) Several candidate Polygenic Risk Scores (PRSs) were created using summary statistics from the Meta5 PD GWAS excluding UKB participants. For each candidate PRS, the degree of variation in PD risk explained was estimated using Nagelkerke’s pseudo-R2 metric. 95% CIs were derived from 1000 bootstrap resamples of the training dataset. As test statistics were approximately normally distributed, 95% CIs were derived from the normal distribution (mean±1.96 x SE). (B) Normalised PRS values for incident PD cases and controls. (C) OR of PD by PRS decile compared with lowest PRS decile. (D) Correlation between increasing PRS and earlier age at PD diagnosis. GWAS, genome-wide association studies; PD, Parkinson’s disease.

