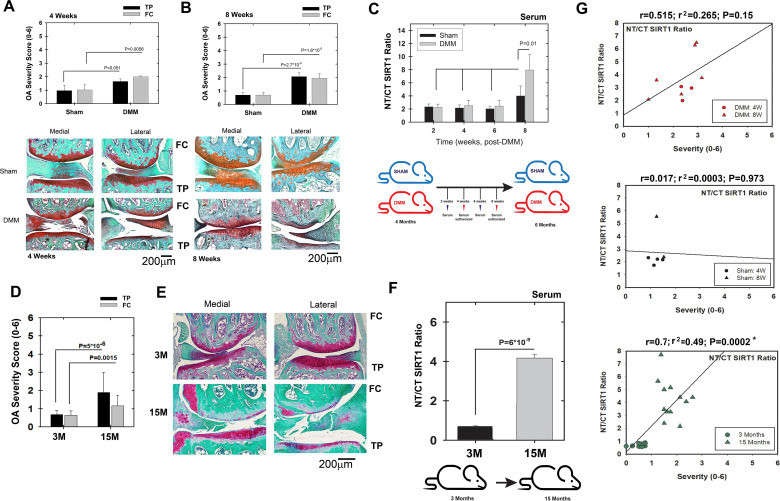
Figure 2.
Increased N-terminal (NT)/C-terminal (CT) SIRT1 ratio is observed in moderate osteoarthritis (OA) severity in wild-type (WT) mice. WT (male and female) Sirt1 mice 3M were subjected to destabilisation of the medial meniscus (DMM) or sham procedures (see the Materials and methods section, supplemental text 1) and euthanised at 4 and 8 weeks post DMM. Joints were harvested and processed for histology (Safranin O/Fast green staining) and ranked for OA severity based on Glasson et al 30, for tibial plateau (TP) or femoral chondyle (FC). Representative sections for each time point are presented underneath each OA ranking diagram. (A) 4 weeks: sham, n=7; DMM, n=6. (B) 8 weeks: sham, n=8; DMM, n=10. (C) Indirect ELISA of serum derived from WT sham and DMM mice (time points 2, 4, 6 and 8 weeks post procedure, n=7). Below the graph is a scheme of the experimental set-up: (D) WT (female) Sirt1 mice 3M and 15M were euthanised, joints harvested and processed for histology (Safranin O/Fast green staining) and ranked for OA severity based on Glasson et al. 30 (E) Representative sections for each time point (n=8). (F) Indirect ELISA of serum derived from 3M and 15M mice (n=6). Below the graph is a scheme of the experimental set-up. Statistical significance is indicated by an asterisk (*, p<0.05) based on Mann-Whitney analysis. (G) Correlations of NT/CT SIRT1 ratio versus OA severity per individual mouse within the DMM (upper graphs); sham (middle graph) and ageing cohorts (lower graph). Correlations are presented as Pearson’s correlation (r; 1 being the best linear fit and 0 being the weakest fit), linear regression (r2) and p value.

