Figure 5.
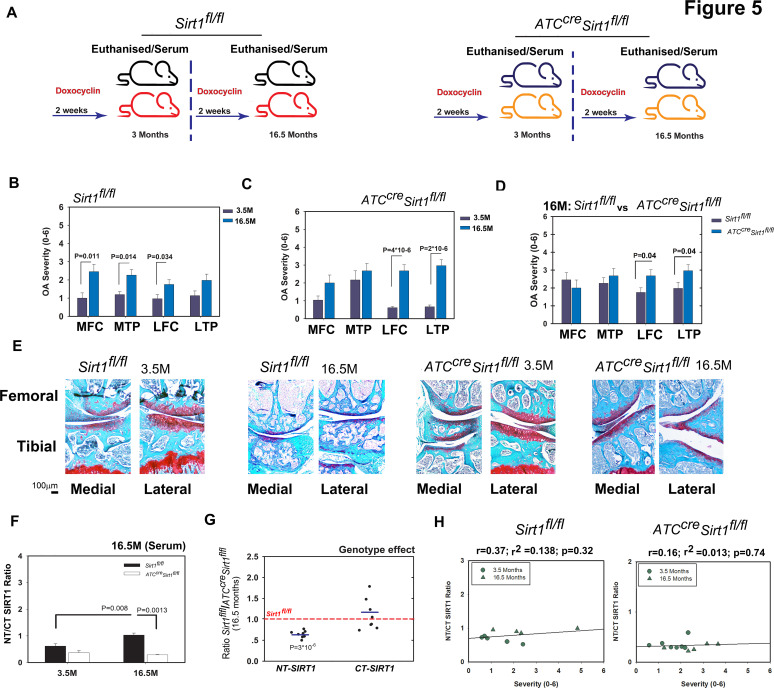
Ablation of Sirt1 in cartilage reduced N-terminal (NT)/C-terminal (CT) SIRT1 ratio in serum of aged versus young mice. (A) Scheme of the experimental set-up: wild-type (WT) Sirt1fl/fl and ATCcreSirt1fl/fl mice (C57BL/6 background) were treated as detailed in the Materials and methods section and euthanised at 3.5 and 16.5 months. Following sacrifice, osteoarthritis (OA) severity ranking was carried out based on joint sections stained with Safranin O/Fast green staining and subsequently graded using Glasson 2010 criteria for medial tibial plateau (MTP), lateral tibial plateau (LTP), medial femoral chondyle (MFC) and lateral femoral chondyle (LFC) of the following. (B) 3.5 (n=5, 40% male) versus 16.5 (n=7, 0% male) months Sirt1fl/+. (C) 3.5 (n=5, 60% male) versus 16.5 (n=13, 100% male) months ATCcreSirt1fl/fl and (D) 16.5 months Sirt1fl/fl versus 16.5 months ATCcreSirt1fl/fl. (E) Representative histological images (Safranin O/Fast green staining) for each genotype and treatment. (F) NT/CT SIRT1 ratio was established based on the indirect ELISA method for serum of Sirt1fl/fl and ATCcreSirt1fl/fl mice subject to sham or DMM procedures. (G) Individually detected levels of NT Sirt1 or CT Sirt1 variants for old (16.5 months) ATCcreSirt1fl/fl and compared with Sirt1fl/fl baseline (broken bar). Statistical significance is indicated by an asterisk (*, p<0.05) based on Mann-Whitney analysis. (H) Correlations of NT/CT SIRT1 ratio versus OA severity per individual mouse within the 3.5 months and 16.5 months Sirt1fl/fl (left graphs) and age-matched ATCcreSirt1fl/fl (right graph). Correlations are presented as Pearson’s correlation (r; 1 being the best linear fit and 0 being the weakest fit), linear regression (r2) and p value.

