
Figure 3.
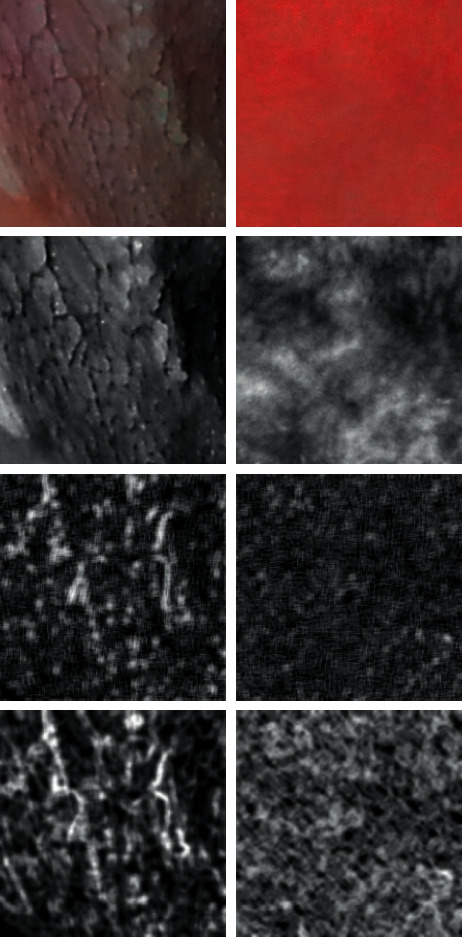
Analyzed images. Left column: leukoplakia of oral mucosa. Right column: normal oral mucosa. In top: raw photographic images. In second row: images after transformation to the 8 bit normalized grey scale. Third row: short run emphasis inverse moments map (number of short lines of similar pixels increased in some regions of leukoplakia-left image). In bottom: maps of entropy distribution in the image (inside leukoplakia, foci are dark areas of low entropy mixed with high entropy plates; in normal mucosa, entropy is distributed regularly).