. 2020 Sep 8;8(9):e18694. doi: 10.2196/18694
©Daniel Fuller, Emily Colwell, Jonathan Low, Kassia Orychock, Melissa Ann Tobin, Bo Simango, Richard Buote, Desiree Van Heerden, Hui Luan, Kimberley Cullen, Logan Slade, Nathan G A Taylor. Originally published in JMIR mHealth and uHealth (http://mhealth.jmir.org), 08.09.2020.
This is an open-access article distributed under the terms of the Creative Commons Attribution License (https://creativecommons.org/licenses/by/4.0/), which permits unrestricted use, distribution, and reproduction in any medium, provided the original work, first published in JMIR mHealth and uHealth, is properly cited. The complete bibliographic information, a link to the original publication on http://mhealth.jmir.org/, as well as this copyright and license information must be included.
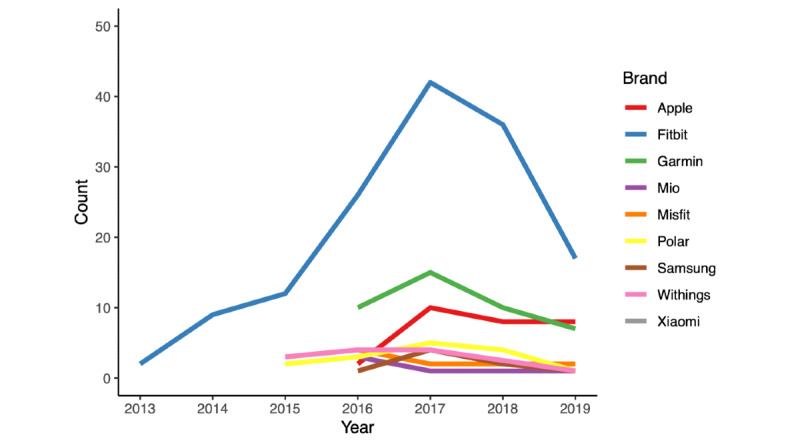
Figure 3.

Line graph of studies published per year by device brand.
